Market Recap
On Thursday, spot gold traded near $4,361.62/oz, hitting another record high and nearing the $4,380/oz mark as escalating trade tensions and the ongoing US government shutdown drove investors toward safe-haven assets.
Meanwhile, the credit market came under stress following three suspected fraud cases, fueling concerns of deeper structural cracks.
US crude traded around $57/bbl, falling more than 2% after President Donald Trump said he and Vladimir Putin agreed to hold another summit to discuss ending the Ukraine war.
Gold
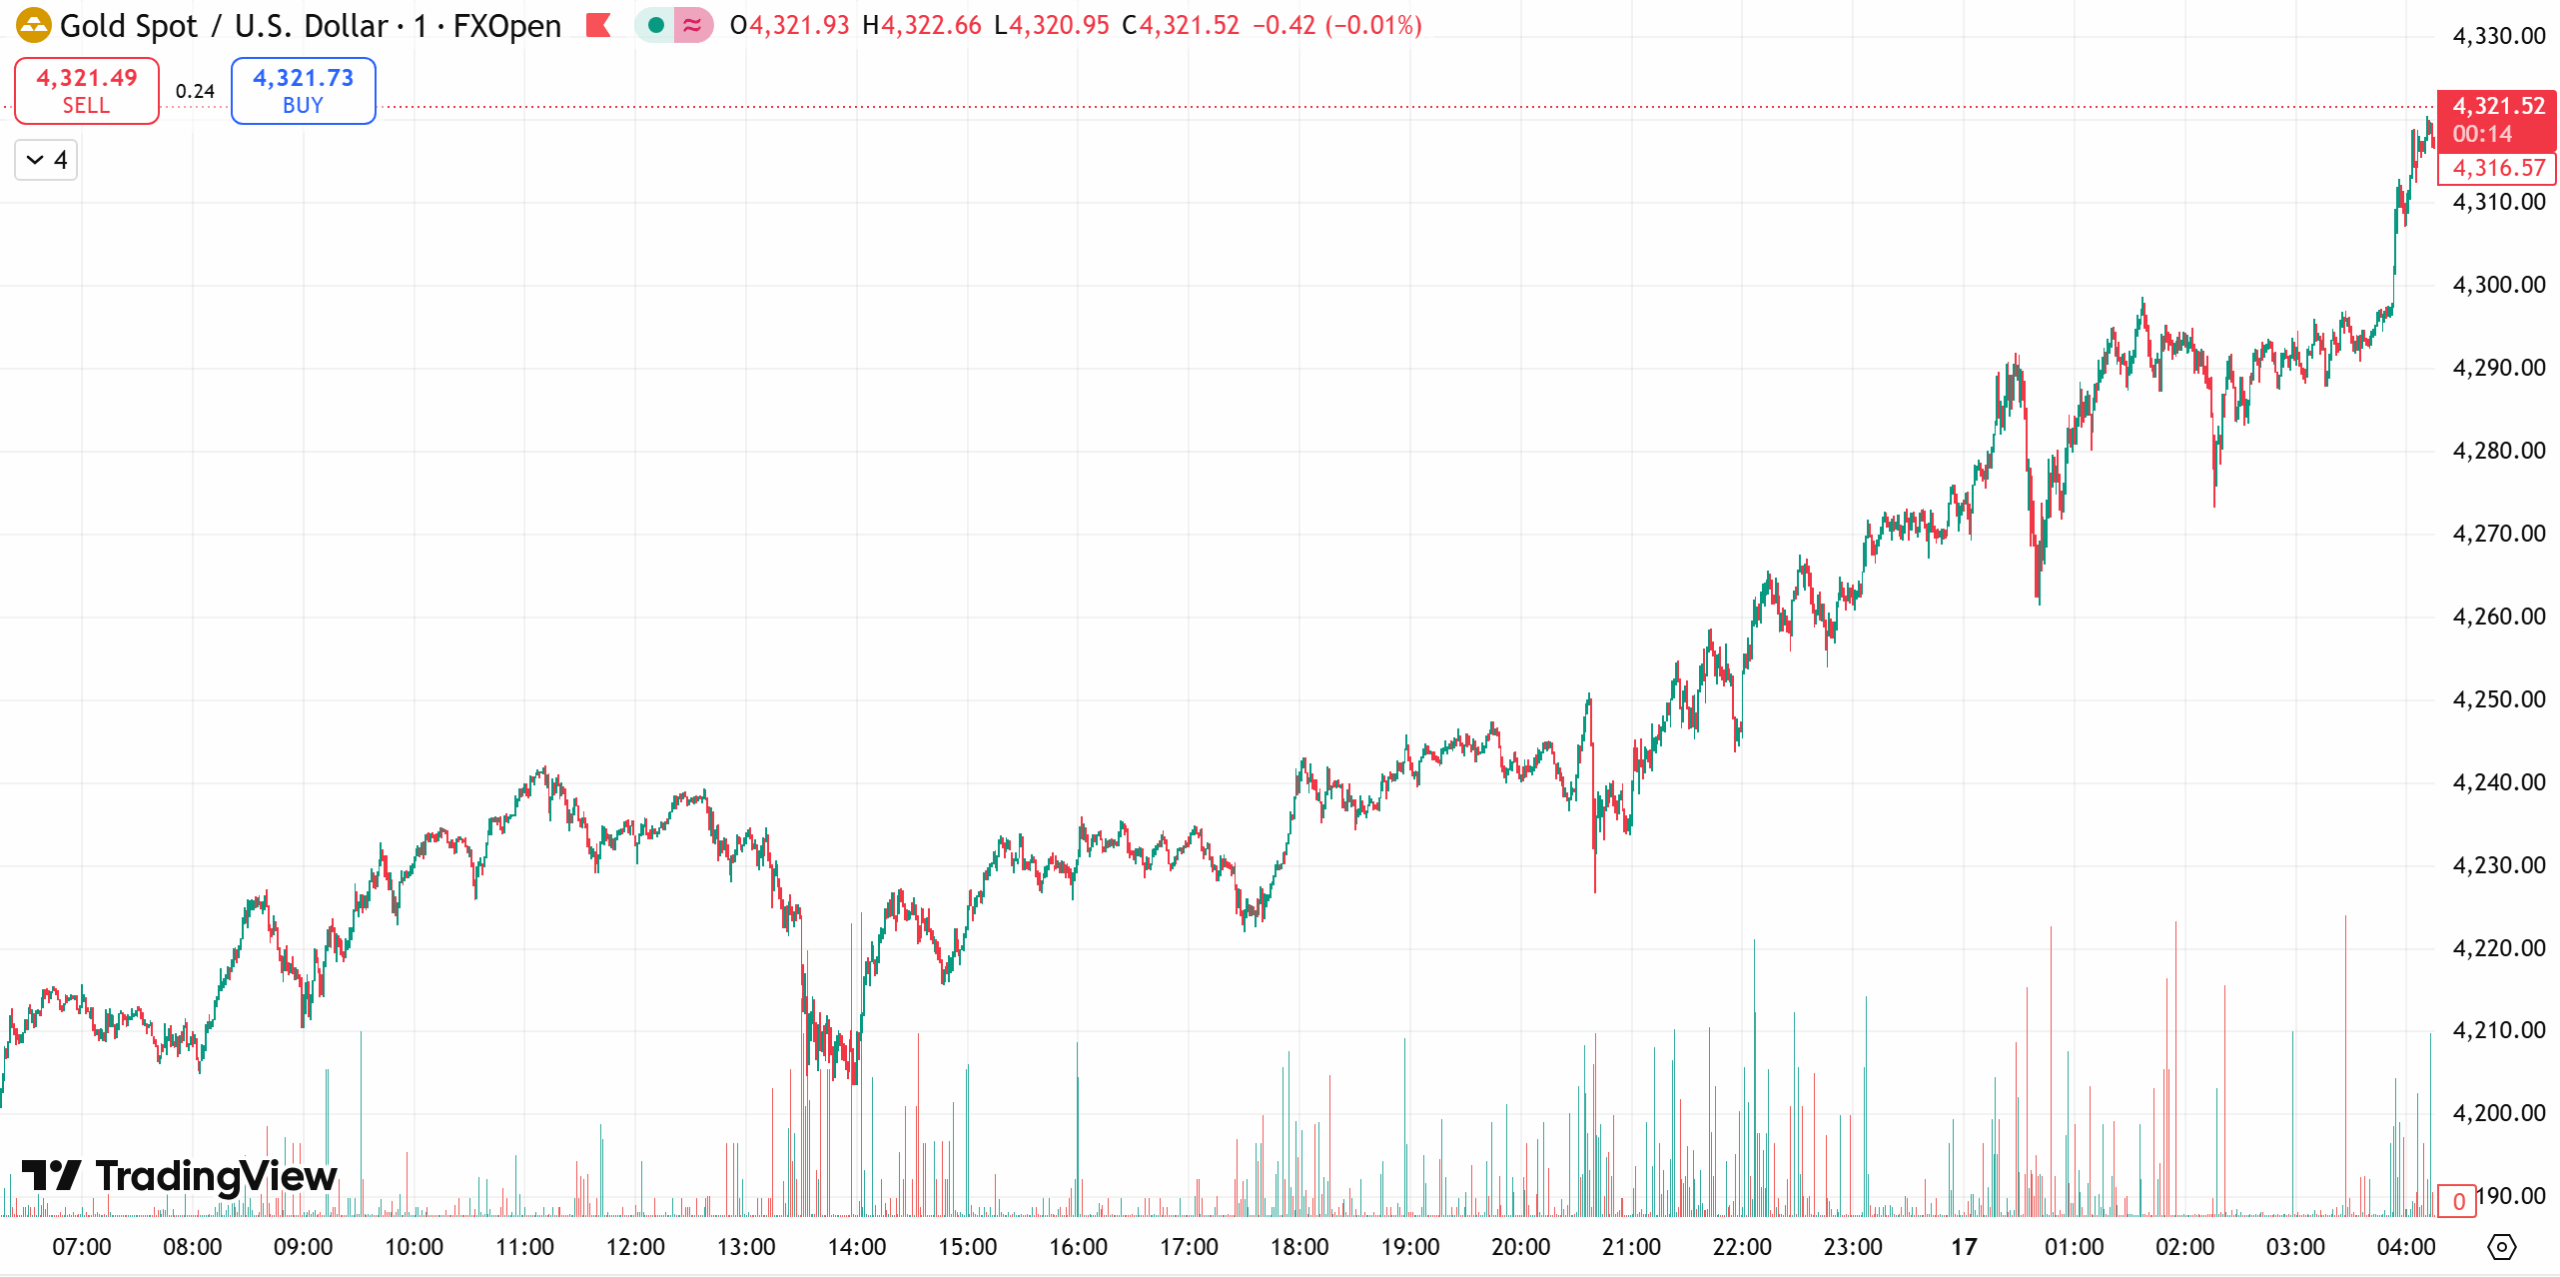
Gold extended its rally for the fourth consecutive session, soaring above $4,300/oz as investors flocked to the metal amid rising trade frictions and political uncertainty in the US
Spot gold reached an all-time high of $4,379.38/oz, while December gold futures also hit a record at $4,335/oz.
Year-to-date, gold has surged over 60%, powered by geopolitical tensions, aggressive rate-cut bets, central bank purchases, the de-dollarization trend, and robust ETF inflows.
Traders now expect the Federal Reserve to cut rates by 25 bps in October and again in December, with 98% and 95% probabilities, respectively.
In a low-rate environment, non-yielding assets like gold typically perform well.
Market analyst Vawda noted that short-term pullbacks are likely to be temporary, as bullish investors tend to rebuild long positions on dips.
Gold Technical outlook:
Gold closed near record highs overnight, with bulls maintaining firm control. Prices remain comfortably above both short- and long-term moving averages, reflecting strong momentum and sustained buying interest.
The $4,200 zone has acted as reliable support, aligning with the 21-period SMA on the 4-hour chart. Deeper pullbacks toward $4,065 (50-SMA) appear unlikely for now, as the current trend strength continues to favor buy-the-dip activity.
Today’s Gold Outlook:
- Strategy: Buy on pullbacks, sell on rebounds
- Resistance: $4,380 – $4,400
- Support: $4,340 – $4,320
Crude Oil
Oil prices fell more than 3% Thursday after President Trump said he and Putin would hold another summit to discuss ending the Ukraine conflict, adding fresh uncertainty to global energy supply.
Trump said the two leaders had a productive two-hour call and plan to meet soon in Budapest — a meeting later confirmed by the Kremlin, though without a set date.
“Geopolitical tension among the US, Russia, and Ukraine is resurfacing,” said Tim Snyder, Chief Economist at Matador Economics, noting that the development prompted some traders to exit positions.
Additionally, data from the EIA showed US crude inventories rose 3.5 million barrels to 423.8 million, far above expectations of a 288,000-barrel increase, as refineries slowed operations during seasonal maintenance.
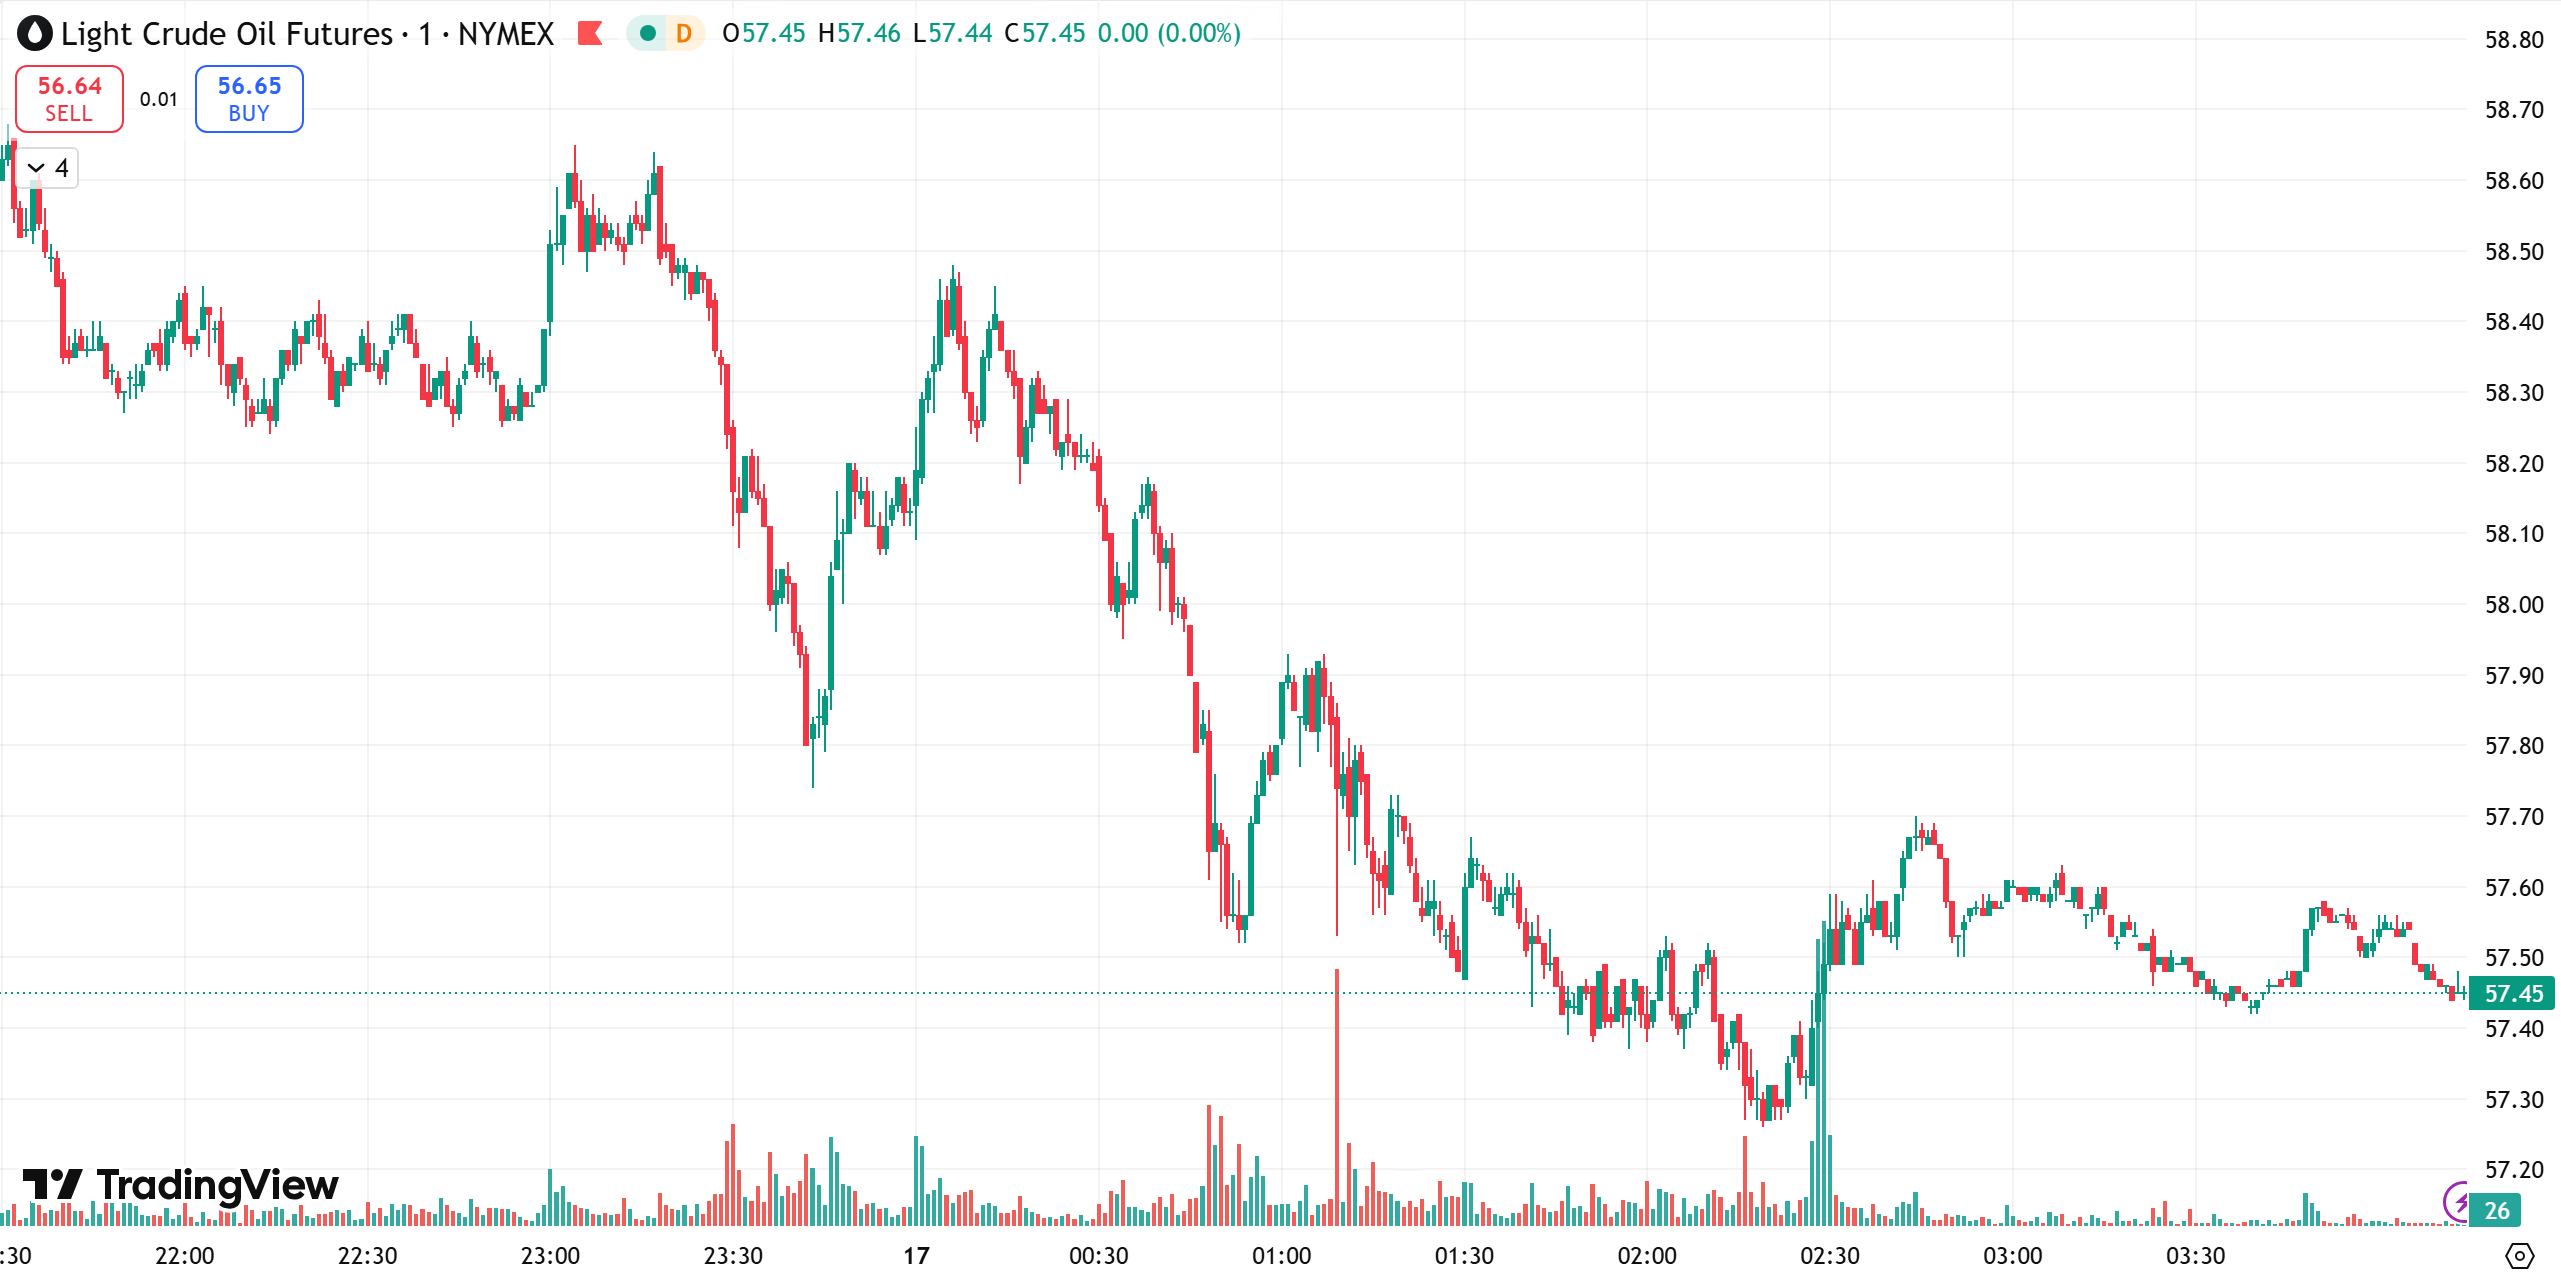
Technical outlook:
Oil remains in a clear downtrend on the daily chart, with MACD lines diverging below zero and bearish momentum dominant.
On the hourly chart, crude fell to a new low near $57.30/bbl before a weak rebound. The downward-sloping moving averages continue to cap gains, signaling that short-term momentum remains negative.
Today’s Outlook:
- Strategy: Sell on rebounds, buy on dips
- Resistance: $59.0 – $60.0
- Support: $56.0 – $55.0
Risk Disclosure
Securities, Futures, CFDs and other financial products involve high risks due to the fluctuation in the value and prices of the underlying financial instruments. Due to the adverse and unpredictable market movements, large losses exceeding your initial investment could incur within a short period of time.
Please make sure you fully understand the risks of trading with the respective financial instrument before engaging in any transactions with us. You should seek independent professional advice if you do not understand the risks explained herein.
Disclaimer
This information contained in this blog is for general reference only and is not intended as investment advice, a recommendation, an offer, or an invitation to buy or sell any financial instruments. It does not consider any specific recipient’s investment objectives or financial situation. Past performance references are not reliable indicators of future performance. D Prime and its affiliates make no representations or warranties about the accuracy or completeness of this information and accept no liability for any losses or damages resulting from its use or from any investments made based on it.
The above information should not be used or considered as the basis for any trading decisions or as an invitation to engage in any transaction. D Prime does not guarantee the accuracy or completeness of this report and assumes no responsibility for any losses resulting from the use of this report. Do not rely on this report to replace your independent judgment. The market is risky, and investments should be made with caution.

