

US inflation hit 3.7% and producer prices jumped 1.3% in September. Is stagflation the next market risk? What wages, energy and bond yields say.
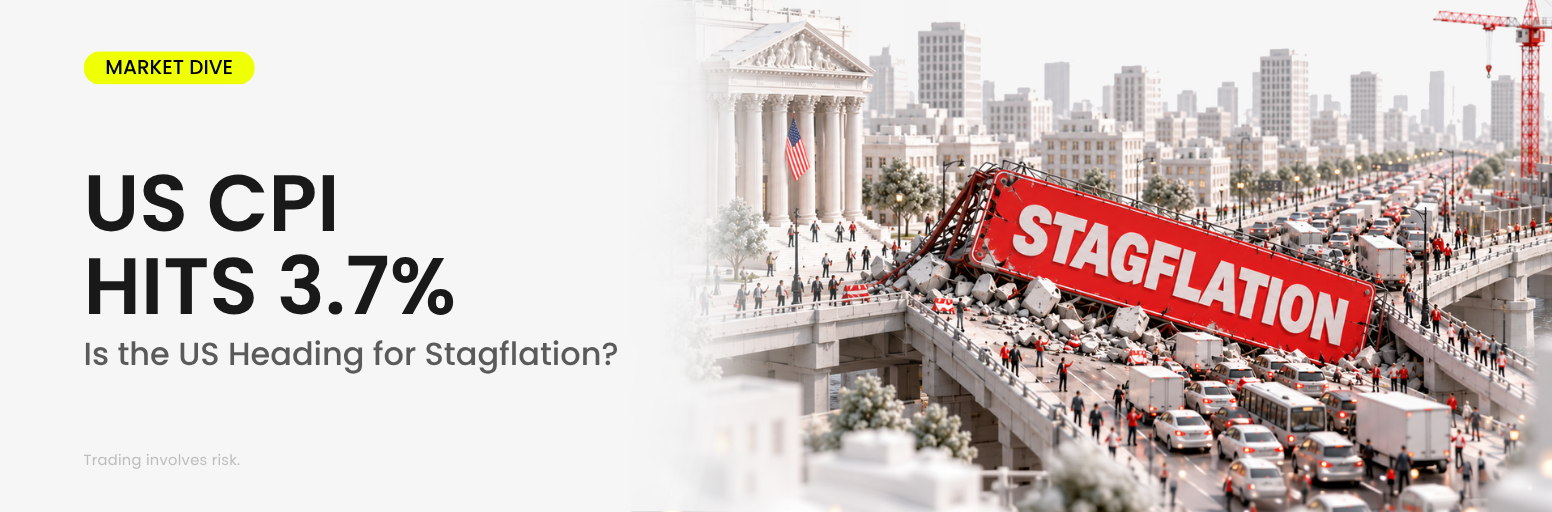
September inflation did more than rise. It started spreading.
US headline CPI accelerated to 3.7% year over year, up from 3.4% in August. Producer prices jumped 1.3% in a single month, the largest increase since March 2022. Energy was still the biggest driver, but price pressure was no longer confined to gasoline and oil.
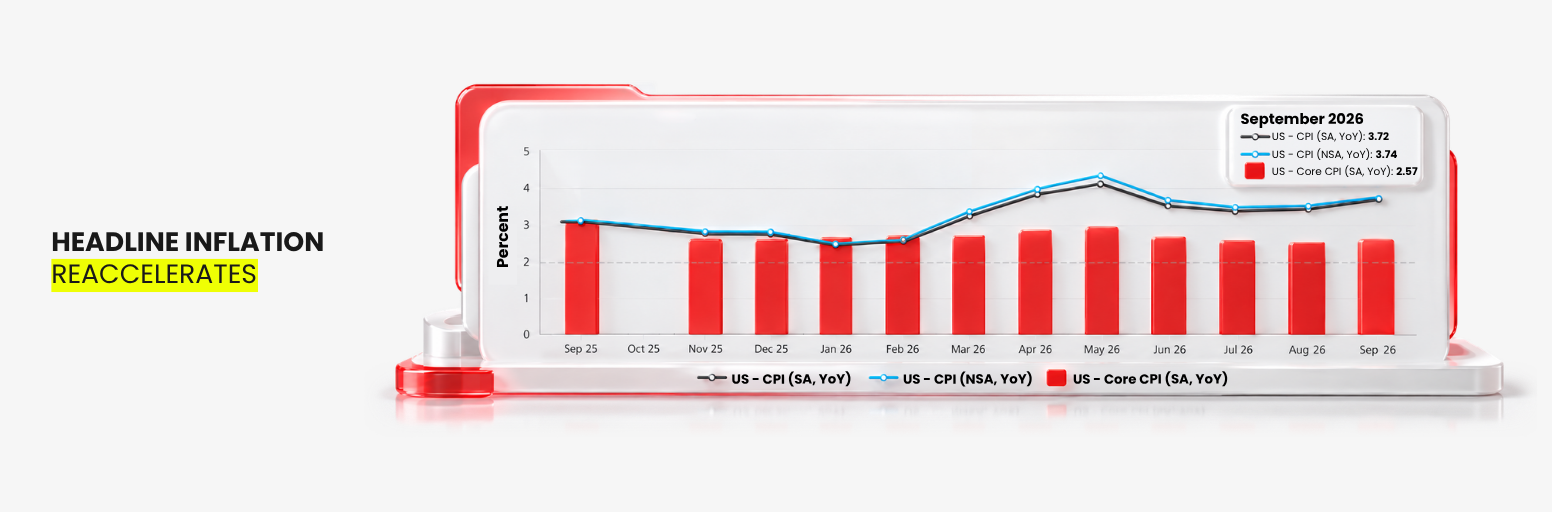
Core goods moved higher. Services stayed sticky. Producer costs accelerated.
So the question facing markets is no longer simply when inflation will return to 2%. It is becoming:
Is the US drifting toward stagflation?
That fear matters because stagflation is one of the hardest environments for policymakers and markets alike. Inflation stays high, growth weakens and central banks are forced to choose between protecting economic activity and controlling prices.
But September’s data do not show that the US has entered another 1970s-style crisis. Not yet. The better reading is this: inflation is getting harder to contain, but several ingredients required for true stagflation are still missing.
Inflation Is Spreading Beyond Oil
September’s CPI report was uncomfortable from almost every angle.
Energy Is Still the Biggest Driver
The Bureau of Labor Statistics reported that headline CPI rose 0.6% month over month and 3.7% year over year, while core CPI increased 0.3% on the month and 2.6% from a year earlier. Gasoline alone accounted for more than half of the monthly increase. The energy index jumped 5.2% in September after rising 2.1% in August, and gasoline surged 9.1%.
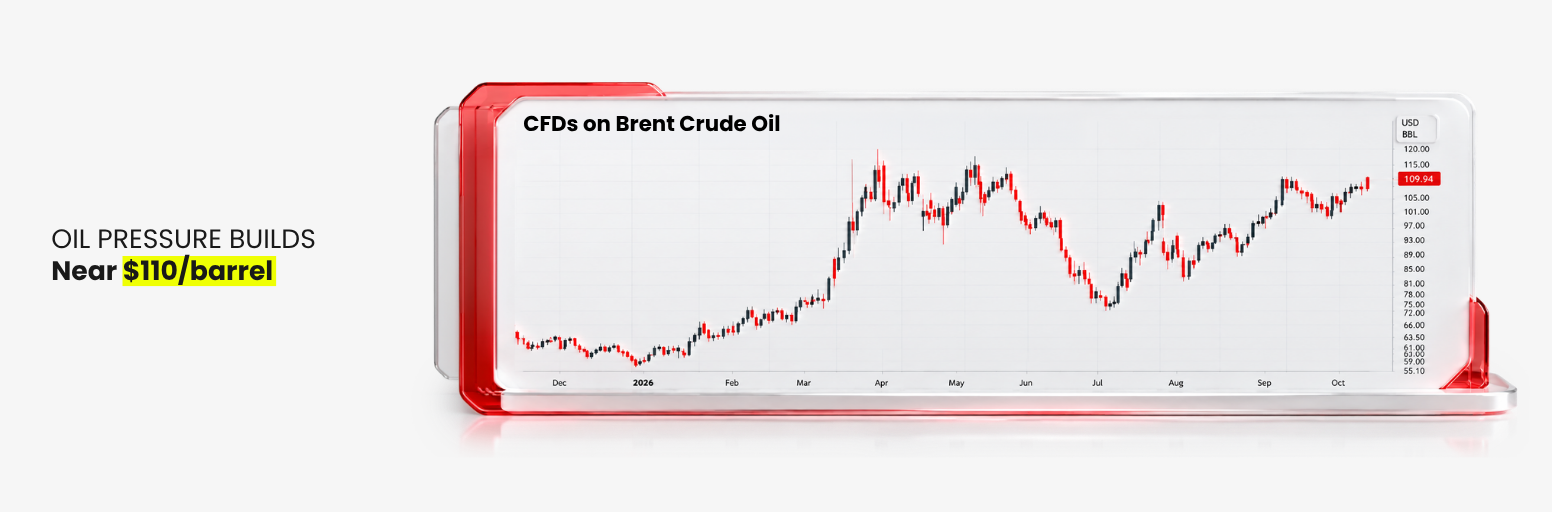
Oil remains a problem. Brent crude was trading at about USD 110 a barrel on the morning of October 19, according to Fortune. The US Energy Information Administration expects Middle East supply constraints to persist through Q4, even as alternative export routes gradually improve flows.
Producer Prices Show the Pressure Broadening
But September’s report also carried a more worrying signal. Shelter rose 0.4%, core goods increased and transportation services stayed elevated.
Upstream, the September PPI report showed final-demand prices jumping 1.3% month over month and 6.3% year over year, with goods up 2.6% and services up 0.8%. Even excluding food, energy and trade services, producer prices rose 0.5% for the month and 5.0% from a year earlier.
That is an important change from only a month ago. In D Prime’s US CPI Meets Forecasts, So Why Did Fed Still Hike?, the central question was why the Fed tightened when headline CPI had merely held at 3.4%. September makes that decision easier to understand.
The issue is no longer just that inflation remains above target. The risk is that an energy shock is beginning to pass through into the wider economy, and once that happens, the Fed’s job becomes much harder.
October May Be a Pause. December Is Another Story.
Hotter inflation does not automatically mean the Fed will hike again next week.
Markets Are Separating the Next Two Meetings
Fed Chair Kevin Warsh declined to signal the next move at the IMF and World Bank meetings in Bangkok on October 16, saying he would not prejudge the decision. Since the September meeting, he said, “the world has broadly conformed to our expectations,” Axios reported.
As of October 20, the CME FedWatch Tool implied roughly an 85% probability that the Fed holds at its October 27 to 28 meeting. December looks very different, with markets pricing roughly a 90% probability of another increase by then.
Why the Fed Can Afford to Wait
Financial conditions have already tightened sharply. The Fed raised rates in September, long-term Treasury yields remain above 5% and mortgage rates are elevated. Meanwhile, September payroll growth slowed to just 29,000 while unemployment held at 4.2%.
That gives policymakers a reason to collect more evidence before tightening again. But another hot inflation report could change that calculation quickly.
October may be a pause. December is another story.
Is This Really Stagflation?
Stagflation is not simply high inflation. It is the combination of persistent inflation and sustained economic stagnation, often accompanied by worsening employment and weak productivity.
The US clearly has the inflation part. The stagnation part is much less convincing, and on several counts today looks very different from the 1970s.
Consumers Are Spending, but Getting Less
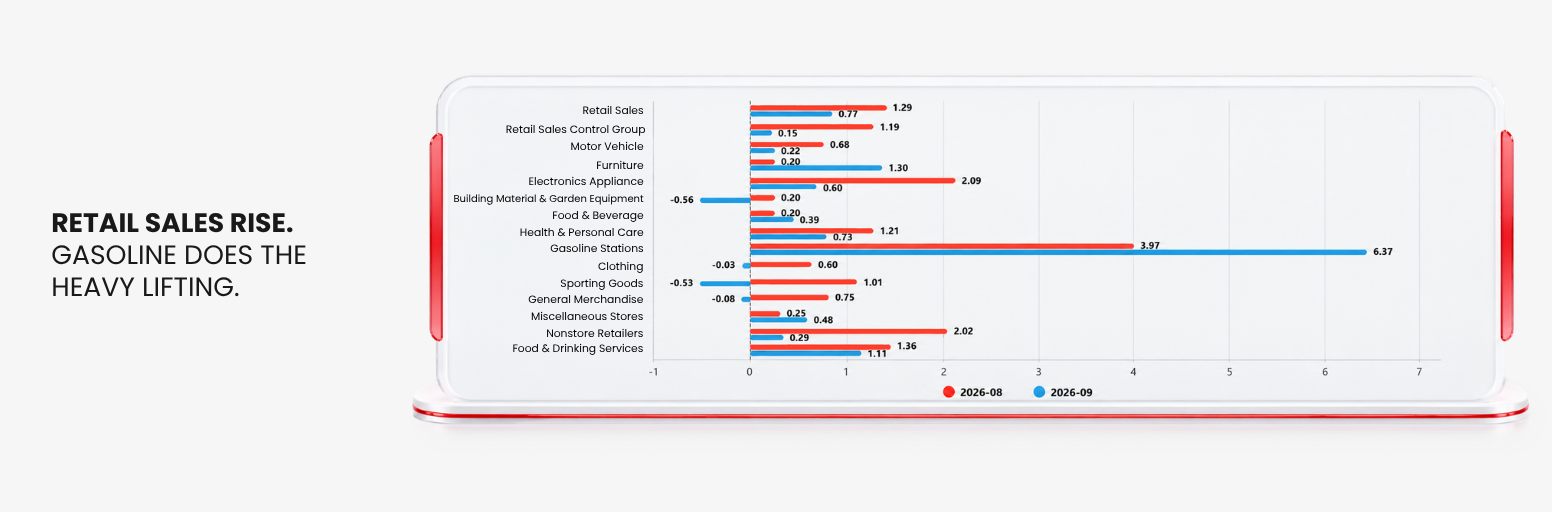
Economic activity remains uneven rather than uniformly weak. AI investment is booming, technology spending remains strong and consumers are still spending in nominal terms. September retail sales rose 0.8% month over month and 6.3% year over year.
But retail sales are not adjusted for inflation, and consumer prices rose 0.6% in the same month. Excluding gas stations, sales rose just 0.2%. Consumers are still spending. They are just getting less for every dollar. That is painful, but it is not the same thing as broad stagnation.
The US economy remains highly divided, as D Prime highlighted in our Q4 2026 Market Outlook: 4 Key Signals Traders Watch. AI, data centers and technology investment remain strong while many rate-sensitive sectors look much weaker. That K-shaped economy creates pockets that may already feel stagflationary, without making stagflation the dominant national regime.
No Wage-Price Spiral Yet
The missing ingredient is wages. In September, average hourly earnings increased only 0.1% month over month and 3.0% year over year. Inflation rose faster, so real average hourly earnings fell 0.5% in September and 0.7% from a year earlier.
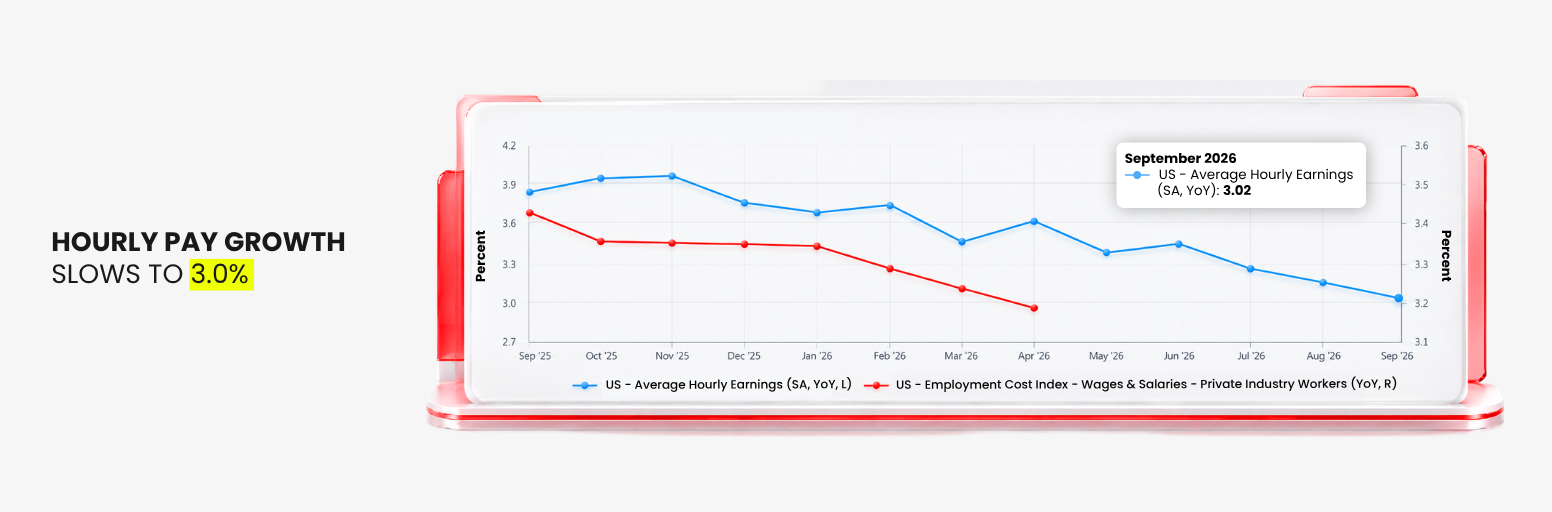
For households, that is bad news. For the inflation outlook, it is important. In a classic wage-price spiral, workers respond to rising living costs by demanding substantially higher wages, companies raise prices to cover those costs, and the cycle feeds on itself. That dynamic was central to the Great Inflation, when high inflation became embedded in wage negotiations, price setting and long-term expectations.
September’s labor data show the opposite. Nominal wage growth is cooling, real wages are falling and employment growth is soft. Energy is spreading into prices, but the stickiest stage of the inflation process has not clearly arrived.
The Economy Uses Less Energy
The US economy is also far less energy-intensive than it was in the 1970s. EIA data show that US energy intensity, the energy used per unit of real GDP, has dropped by about half since 1983.
A major supply shock can still hurt households, freight, airlines, manufacturing and inflation. But the economy is less mechanically dependent on every additional barrel than it was during the 1970s.
Monetary Policy Has Changed
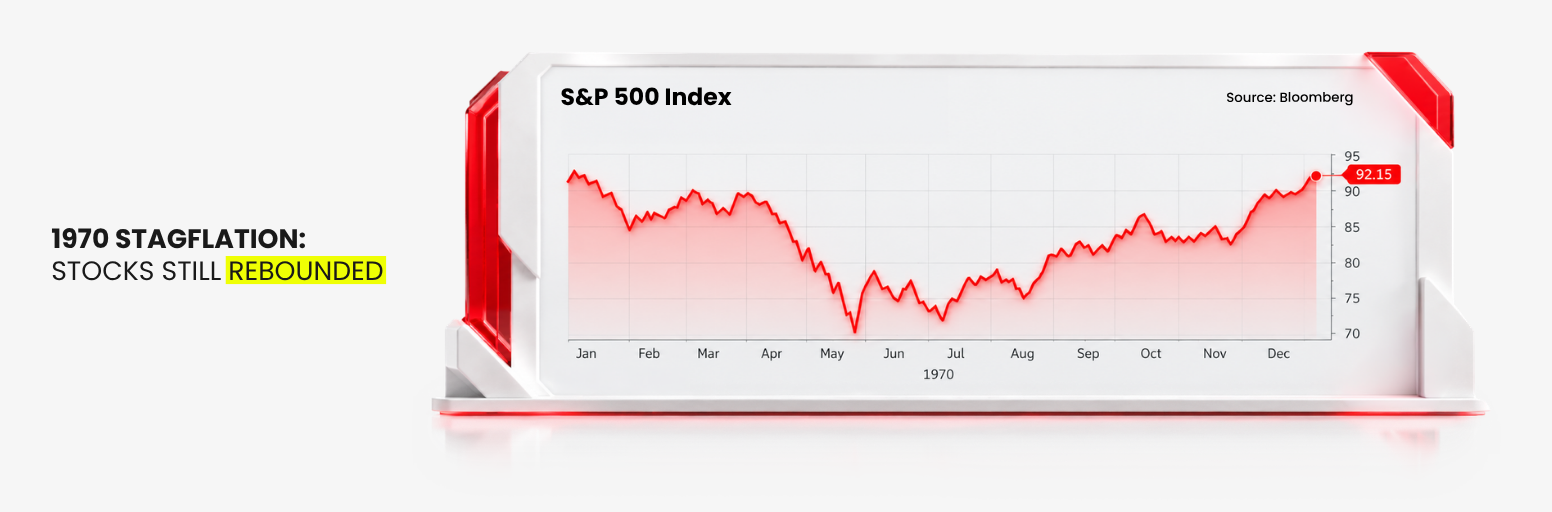
The Great Inflation lasted from roughly 1965 to 1982, included two major energy crises and eventually required Paul Volcker’s Fed to push the federal funds rate close to 20% to break it. Today, central banks have a much clearer price-stability framework and are far more sensitive to inflation expectations becoming unanchored. That does not guarantee success, but it makes a simple repeat of the 1970s much less likely.
So the correct conclusion is not that stagflation has returned. The market is experiencing a stagflation scare, and the risk rises if inflation stays broad while growth begins to weaken materially.
AI Is Fueling Inflation Before It Fights It
There is another force complicating the story: artificial intelligence.
The Demand Arrives First
AI is often described as a future disinflationary technology. If it raises worker productivity and lowers operating costs, it should eventually expand economic supply. The problem for the Fed is timing. The inflation arrives first. The productivity payoff comes later.
Billions are being spent on data centers, GPUs, electricity, networking equipment and construction. That is the same buildout behind this month’s chip-stock volatility, which we examined in OpenAI Revenue Scare: Is the AI Chip Boom Really Slowing?. Until productivity catches up, the AI boom can keep parts of the economy running hotter than they otherwise would.
The Fed Is Already Saying So
Fed Governor Lisa Cook highlighted exactly this tension in a speech on September 28. She noted that prices for AI-related goods have surged and that data-center investment relies on inputs such as construction labor and energy. She expects productivity to bring modest disinflation within the next few years, but said she does not expect those effects “to arrive in time to offset the broadening inflationary pressure later this year.”
Governor Michael Barr made a similar argument the following day, pointing to “a surge in prices for computer chips and related equipment” and warning that “those price increases are spreading to other products that require chips.”
So oil is not the only inflation story. AI may be adding demand pressure at exactly the moment the Fed is trying to cool the economy.
The Bond Market May Be the Bigger Constraint
The most immediate risk for markets may not be another 25-basis-point Fed hike. It may be the level of long-term interest rates the bond market has already imposed.
Long Yields Are Doing the Fed’s Work
The 10-year Treasury yield closed at 5.12% and the 30-year at 5.42% on October 20, according to US Treasury data. Financial conditions therefore remain restrictive even if the Fed waits in October.
The Fed controls overnight rates directly, but not the 10-year or 30-year yield, which also reflect inflation expectations, growth, fiscal borrowing and the term premium. We set out why the bond market has been tightening faster than the Fed in our Q4 2026 Market Outlook, and the structural pressure behind it in US Treasury Yields Stay High: Is a Debt Crisis Coming?.
The Fiscal Backdrop and the Midterms
The fiscal pressure behind those yields is getting larger, not smaller. The Congressional Budget Office estimates the federal deficit totaled USD 2.0 trillion in fiscal 2026, USD 218 billion more than the year before.
The midterm elections on November 3 add another layer. For markets, the questions are practical rather than partisan: whether the next Congress makes major fiscal legislation easier or harder, whether regulation around AI, data centers and energy changes, and whether uncertainty affects Treasury issuance or confidence in the fiscal outlook. The election can change the path. It is unlikely to erase the underlying problem.
What It Means for Other Assets
Higher long-term yields weigh hardest on assets whose value depends on distant earnings, while companies delivering real growth and cash flow can keep outperforming. For equities, the dollar and gold, we broke down how each tends to respond to a higher-for-longer regime in Fed, ECB and BOJ Hike Rates: Is Higher for Longer the New Global Regime?.
Oil is the one inflation driver the Fed cannot fix. With the EIA forecasting Brent to average around USD 105 per barrel in Q4, higher rates can only weaken demand enough to limit the secondary effects.
What Should Traders Watch Next?
The next few weeks will show whether September was a temporary inflation shock or the beginning of something more persistent.
October 27 to 28: FOMC
Markets overwhelmingly expect the Fed to hold, so the language will matter more than the decision. Watch whether Warsh emphasizes patience or signals that December is becoming the next likely tightening point.
November 3: US Midterm Elections
Watch for any shift in the fiscal outlook or Treasury issuance expectations that pushes long-term yields higher.
November 6: October Jobs Report
September produced only 29,000 new payrolls. Another soft reading would strengthen the case that demand is cooling beneath the inflation headline. A rebound would give the Fed more room to tighten.
November 10 and 13: October CPI and PPI
CPI may be the most important release. If energy inflation cools and core stabilizes, September will look more like a shock. If core accelerates again, the stagflation debate becomes much harder to dismiss. PPI on November 13 will show whether September’s 1.3% jump in producer prices was a one-off.
Beyond the calendar, keep watching three signals: Brent crude, the 10-year Treasury yield and real wage growth. Together, they will show whether the shock is spreading, whether financial conditions are tightening further and whether households can absorb the pressure.
Stagflation Is a Risk, Not the Base Case
What September Changed
September changed the inflation story. CPI accelerated, producer prices surged, energy pressure broadened and markets increasingly expect another hike before year-end. Those are not trivial developments, but they are not yet proof that America is returning to the 1970s. Wage growth is cooling, real earnings are under pressure rather than overheating, the economy is far less energy-intensive and the slowdown remains uneven rather than recessionary.
Less Room for Error
The bigger change is that markets have entered a regime where inflation, growth and rates can pull in opposite directions at the same time. That makes every inflation report more important, and it leaves less room for error in assets that rely on cheap liquidity.
By D Prime Analysis Team
Macro and market strategy research by D Prime’s in-house analysis team.
Disclaimer
The information contained herein is provided for general informational and educational purposes only and does not constitute investment advice, financial advice, trading advice or any other form of professional advice, a recommendation, or an offer or solicitation to buy or sell any financial instruments or engage in any trading strategy.
Trading in leveraged products such as contracts for difference (CFDs) involves a significant risk of loss and may not be suitable for all investors. Past performance is not indicative of future results. Any references to market trends, asset performance, price levels, or forward-looking statements reflect opinions or general market commentary as at the date of publication and are subject to change without notice.
This article does not take into account any individual investor’s objectives, financial situation, or risk tolerance. Readers should conduct their own independent research and seek professional advice before making any investment or trading decisions. D Prime and its affiliates make no representations or warranties about the accuracy or completeness or reliability of this information and disclaim any and all liability for any direct, indirect, incidental, consequential, or other losses or damages arising out of or in connection with the use of or reliance on any information contained herein. The above information should not be used or considered as the basis for any trading decisions or as an invitation to engage in any transaction. Do not rely on this article to replace your independent judgment.
“D Prime” is a brand name of D Prime Vanuatu Limited, a company incorporated and regulated by the Vanuatu Financial Services Commission (Company Number: 700238). The availability of products and services may vary depending on jurisdiction and applicable regulatory requirements.