


A stronger yen, BOJ rate hike risk and carry trade unwinds could tighten liquidity and pressure the global market rally in 2026.
Markets are watching the Middle East, oil prices, and the Fed.
But another liquidity risk may be building quietly: the Japanese yen.
Today’s market is not only trading on earnings, inflation, or geopolitics. It is trading on liquidity. Gold’s weak performance since the start of 2026 is already tied to rate-hike expectations driven by inflation, as discussed in D Prime’s “Gold Outlook 2026: Why Gold May Stay Range-Bound in H2.”
Now, the yen is becoming another key variable.
The yen has long been one of the world’s most important funding currencies. Because it is a low-yield safe-haven asset, Japanese investors have often exchanged yen for higher-yielding foreign currencies and invested globally through the classic yen carry trade.
This is where “Mrs. Watanabe” comes in. The term refers to Japanese retail investors who use low-interest yen to seek returns abroad. The scale is huge. Data from Japan’s Ministry of Finance shows Japan’s net external assets reached JPY 561.75 trillion at the end of 2025, up 4.4% year over year.
But if the yen appreciates, carry trades become less profitable. Japanese investors may sell foreign assets, convert funds back into yen, and bring money home. That could tighten global liquidity almost like a Fed rate hike.
And right now, the yen is getting close to that turning point.
Why Japan Is Talking Up the Yen
Recently, Japan’s Finance Minister Satsuki Katayama called on public pension funds, including GPIF, to increase their allocation to domestic Japanese financial assets.
This was classic verbal intervention. The signal was simple: Japan wants more domestic capital to stay at home.
Markets reacted quickly. Japanese government bond shorts were forced to cover, the 10-year JGB yield briefly dropped to 2.76% intraday, and the yen saw a short-term rally.
But the move did not last.
GPIF is independent, so the government cannot directly order it to change asset allocation. Japan’s fiscal pressure also remains unresolved. After a brief pullback, USD/JPY resumed its upward trend.
Still, the market treated Katayama’s message as a warning.
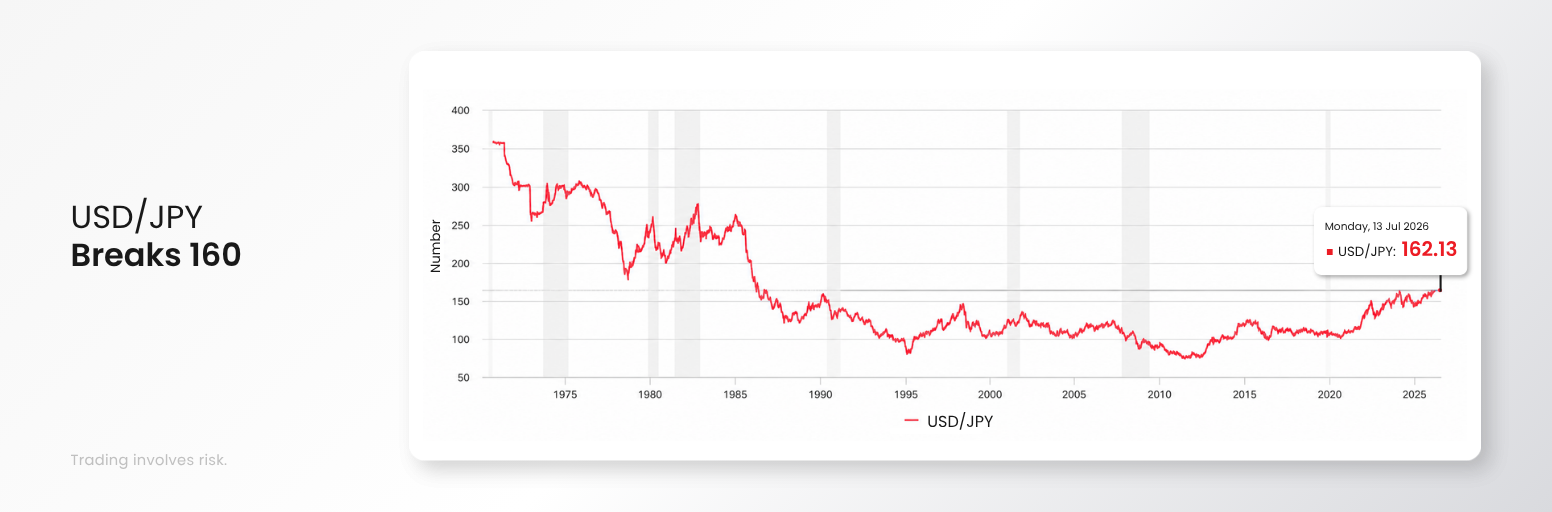
USD/JPY has already broken above 160, reaching a multi-year high. The last time the pair traded around this level was in 1986. That matters because the Plaza Accord in late 1985 forced the yen to appreciate sharply. Now, the yen is almost back to its pre-Plaza Accord level.
Japanese policymakers may be getting uncomfortable.
Why the BOJ Still Has Room to Hike
The market expects the Bank of Japan to hold steady at its July meeting, keeping the short-term policy rate at 1%.
But holding steady does not mean the BOJ is done.
The broader consensus is that the BOJ may hike once more before the end of 2026, potentially lifting the short-term policy rate to 1.25%.
Japan can afford to hike because its economy is showing mild recovery. As D Prime discussed in “2026 Mid-Year Market Outlook: AI Leads. Liquidity Decides,” AI has started a new long-wave economic cycle, and Japan benefits from its position in the global semiconductor supply chain.
That means the yen no longer needs to keep weakening just to support exports.
Inflation also matters. Japan has been less affected by oil price shocks than many major economies, but the BOJ remains alert to inflation risks. At the July meeting, it will likely keep guidance that further rate hikes remain possible.
That keeps yen appreciation risk alive.
Why a Yen Hike Matters for Global Markets
Japan is the largest foreign holder of US Treasuries, with around USD 1.2 trillion in US government bonds.
If yen appreciation forces Japanese investors to bring capital home, they may need to sell foreign assets, including US Treasuries. That could pressure the Treasury market, revive fears around US debt, and create a chain reaction across global assets.
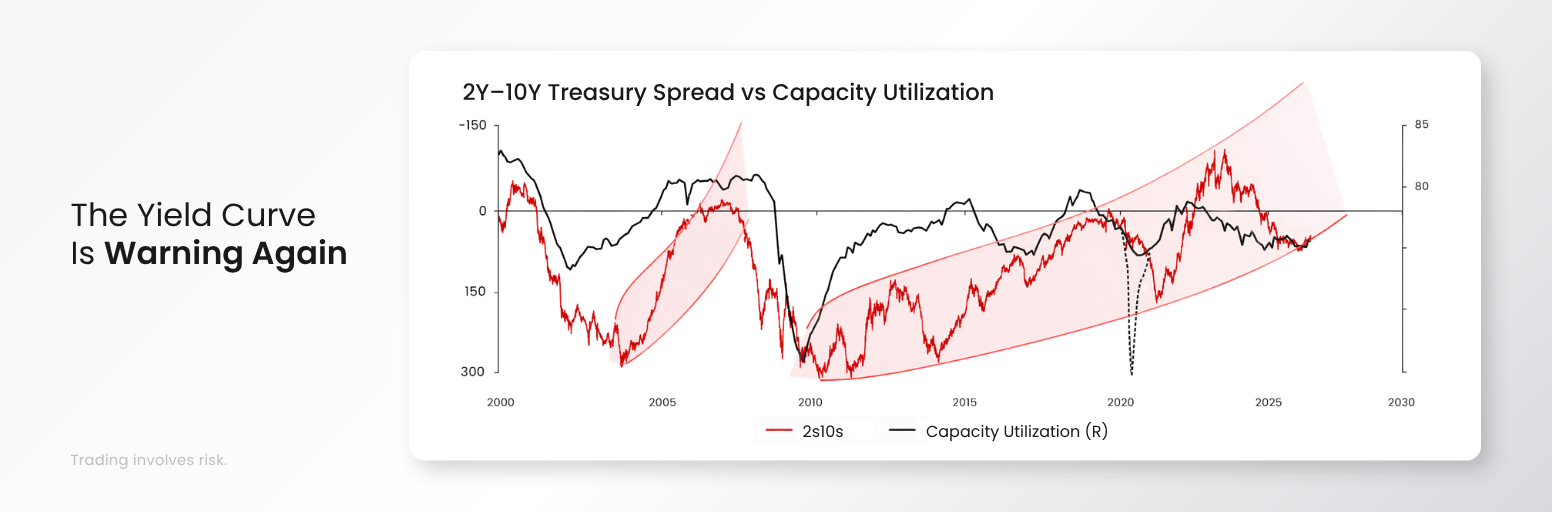
When the 10-year Treasury yield falls below the 2-year yield, the curve is inverted. This often signals concern about stagflation, recession, or future credit stress.
Normally, banks borrow short and lend long. But when the curve is inverted, lending becomes less attractive. Banks may become less willing to lend, creating hidden liquidity tightening, or “reluctance to lend.”
During Jerome Powell’s tenure, forward guidance and QE helped soften this risk by holding down long-term yields and supporting asset prices.
Under Kevin Warsh, this may change.
Warsh is expected to reduce reliance on forward guidance, restore more Fed independence, and push balance sheet reduction. That means the Fed may stop or cut long-term Treasury purchases, handing more risk back to the market.
If Japan sells Treasuries while the Fed is reducing its balance sheet, Treasury pressure could increase. For risk assets, that combination matters.
Why Semiconductors Look Most Sensitive
D Prime’s “2026 Mid-Year Market Outlook” highlighted a K-shaped economy: AI is carrying the recovery, while US consumption and real estate remain only moderate.
That makes the market heavily dependent on one theme: AI.
If Japan sells US Treasuries while inflation stays sticky and the Fed reduces its balance sheet, markets could face a deeper correction. Semiconductors may be especially vulnerable because valuations are already high.
The AI sector still has strong long-term fundamentals, but high-valuation trades are usually the first to feel liquidity pressure.
Recent market action already shows some rotation. After concerns over “excess computing power” emerged and Meta announced plans to sell surplus computing power, the PHLX Semiconductor Index fell 4.37% in that week. At the same time, the Dow Jones Industrial Average rose 1.97% and hit an all-time high.
Valuations leave little room for disappointment. The S&P 500’s Shiller P/E ratio hit 44.2x during the dot-com bubble in December 1999. In May and June 2026, it reached 41.1x and 41.3x. The Nasdaq’s P/E ratio was around 40x, close to its cycle peak of 47.3x at the end of 2024.
A correction looks possible. A crash is not D Prime’s base case.
Commodities and AI Still Offer Mixed Signals
For commodities, gold and crude oil continue to move like a seesaw.
US-Iran negotiations have moved back and forth, but crude oil has fallen sharply from earlier highs. Even when conflict risks flare up again, oil has recently hovered around USD 80. That helps ease inflation pressure.
Gold and silver, however, remain negative year to date. A yen rate hike could support gold short trades because yen appreciation and tighter global liquidity may pressure non-yielding assets.
Still, there are reasons to stay optimistic.
Lower oil prices reduce inflation pressure. AI also still has real demand support. OpenRouter data shows global token call volumes are no longer exploding like in the early stage, but they are still rising steadily. Token call volume reached 47.2 trillion at the end of June, compared with 31.8 trillion on May 25.
AI demand is maturing, not disappearing.
Watch the Yen, Not Just the Fed
The yen may become the hidden liquidity shock traders should not ignore.
If the BOJ hikes rates and the yen appreciates, carry trades could unwind. Japanese investors may bring capital home. US Treasuries may face selling pressure. Global liquidity could tighten.
That does not mean a market crash is guaranteed.
But it does mean markets may become more vulnerable to corrections, especially in crowded trades like semiconductors and high-valuation AI stocks.
Do not only watch the Fed.
Watch the yen.
Because if yen liquidity turns, global markets may feel it fast.
By D Prime Analysis Team
Macro and market strategy research by D Prime’s in-house analysis team.
Risk Disclosure
Trading in Securities, Futures, contracts for difference (CFDs) and other financial products carries high risks due to the rapid and unpredictable fluctuation in the value and prices of these financial instruments. This unpredictability is due to the adverse and unpredictable market movements, geopolitical events, economic data releases, and other unforeseen circumstances. You may sustain substantial losses, including losses exceeding your initial investment within a short period of time.
You are strongly advised to fully understand the nature and inherent risks of trading with the respective financial instrument before engaging in any transactions with D Prime. When you engage in transactions with us, you acknowledge that you are aware of and accept these risks.
Disclaimer
The information contained herein is provided for general informational and educational purposes only and does not constitute investment advice, financial advice, trading advice or any other form of professional advice, a recommendation, or an offer or solicitation to buy or sell any financial instruments or engage in any trading strategy.
Trading in leveraged products such as contracts for difference (CFDs) involves a significant risk of loss and may not be suitable for all investors. Past performance is not indicative of future results. Any references to market trends, asset performance, price levels, or forward-looking statements reflect opinions or general market commentary as at the date of publication and are subject to change without notice.
This article does not take into account any individual investor’s objectives, financial situation, or risk tolerance. Readers should conduct their own independent research and seek professional advice before making any investment or trading decisions. D Prime and its affiliates make no representations or warranties about the accuracy or completeness or reliability of this information and disclaim any and all liability for any direct, indirect, incidental, consequential, or other losses or damages arising out of or in connection with the use of or reliance on any information contained herein. The above information should not be used or considered as the basis for any trading decisions or as an invitation to engage in any transaction. Do not rely on this article to replace your independent judgment.
“D Prime” is a brand name of D Prime Vanuatu Limited, a company incorporated and regulated by the Vanuatu Financial Services Commission (Company Number: 700238). The availability of products and services may vary depending on jurisdiction and applicable regulatory requirements.