Oil remains one of the most volatile assets in 2026, driven by geopolitical risk, uneven global reserves and critical shipping chokepoints such as the Strait of Hormuz.
Who is the most attention-grabbing asset of 2026?
Not gold.
Not Bitcoin.
Not even AI stocks.
The answer is oil.
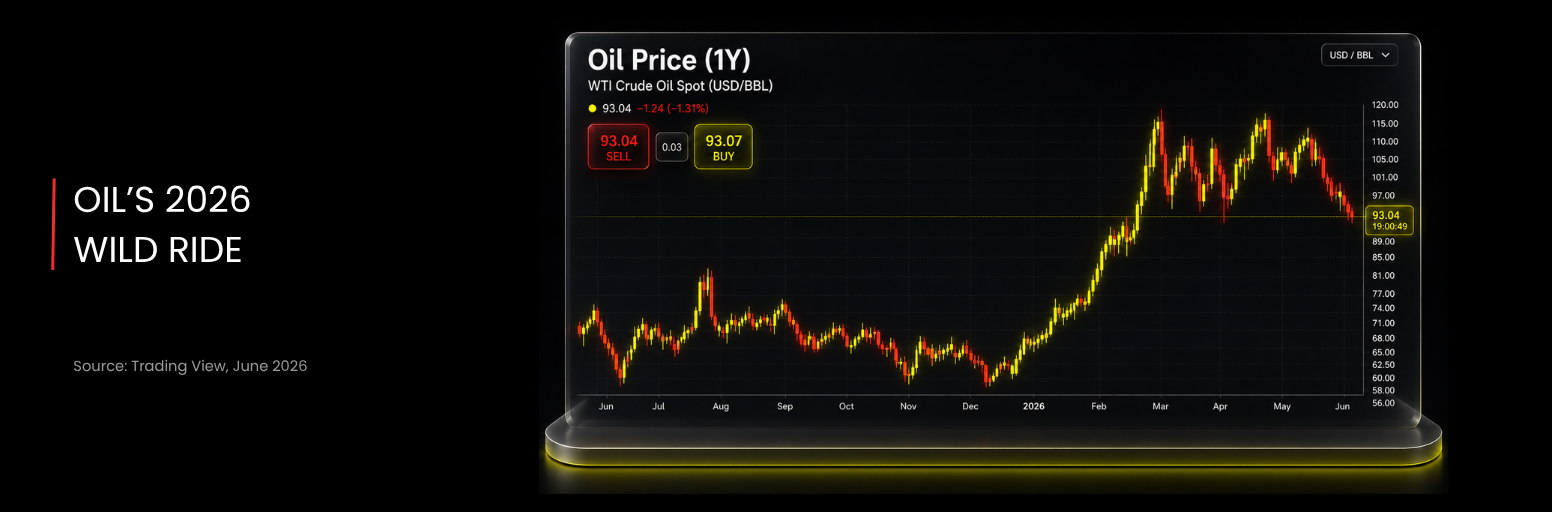
After the US–Iran conflict began, oil prices saw massive swings. Prices jumped from below $60 to nearly $120 at the peak, marking a move of almost 100%.
For CFD traders using leverage, that kind of volatility can create major opportunities. But it also comes with serious risk. Leverage can amplify gains, but it can also magnify losses just as quickly.
This is exactly why oil attracts traders.
When tensions rise in the Middle East, oil prices often surge. When tensions ease, prices can fall just as fast. This creates both long and short trading opportunities.
But here is the real question:
Do you actually understand how oil trades?
That is why D Prime is launching the Oil Trading Playbook series, designed to help traders understand the key forces behind oil prices, from global reserves and supply risks to shipping chokepoints and geopolitics.
Global Oil Reserves Are Unevenly Distributed
Oil is not evenly distributed across the world.
Global oil reserves are highly concentrated in the Middle East and the Americas. The Northern Hemisphere holds more than 70% of proven reserves, while nearly half of global reserves are concentrated in the Middle East.
The top five countries alone account for more than half of the world’s total oil reserves, with Venezuela ranking first.
According to Worldometers, the top 20 countries and regions by oil reserves in 2025 are:
| Rank | Country | 2025 Oil Reserves | Global Share |
|---|---|---|---|
| 1 | Venezuela | 303.008B barrels | 17.17% |
| 2 | Saudi Arabia | 267.230B barrels | 15.14% |
| 3 | Iran | 208.600B barrels | 11.82% |
| 4 | Canada | 163.108B barrels | 9.24% |
| 5 | Iraq | 145.019B barrels | 8.22% |
| 6 | UAE | 113.000B barrels | 6.40% |
| 7 | Kuwait | 101.500B barrels | 5.75% |
| 8 | United States | 83.729B barrels | 4.74% |
| 9 | Russia | 80.000B barrels | 4.53% |
| 10 | Libya | 48.363B barrels | 2.74% |
| 11 | Nigeria | 37.500B barrels | 2.12% |
| 12 | Kazakhstan | 30.000B barrels | 1.70% |
| 13 | China | 28.182B barrels | 1.60% |
| 14 | Qatar | 25.244B barrels | 1.43% |
| 15 | Brazil | 15.894B barrels | 0.90% |
| 16 | Algeria | 12.200B barrels | 0.69% |
| 17 | Guyana | 11.000B barrels | 0.62% |
| 18 | Ecuador | 8.273B barrels | 0.47% |
| 19 | Azerbaijan | 7.000B barrels | 0.40% |
| 20 | Norway | 6.912B barrels | 0.39% |
This shows a clear imbalance.
North America and Asia Pacific are two of the most economically active regions in the world, but they account for only 13.3% and 2.8% of global reserves, respectively.
China, one of the world’s largest manufacturing economies, does not even rank in the top 10 for oil reserves. It ranks behind countries such as Nigeria.
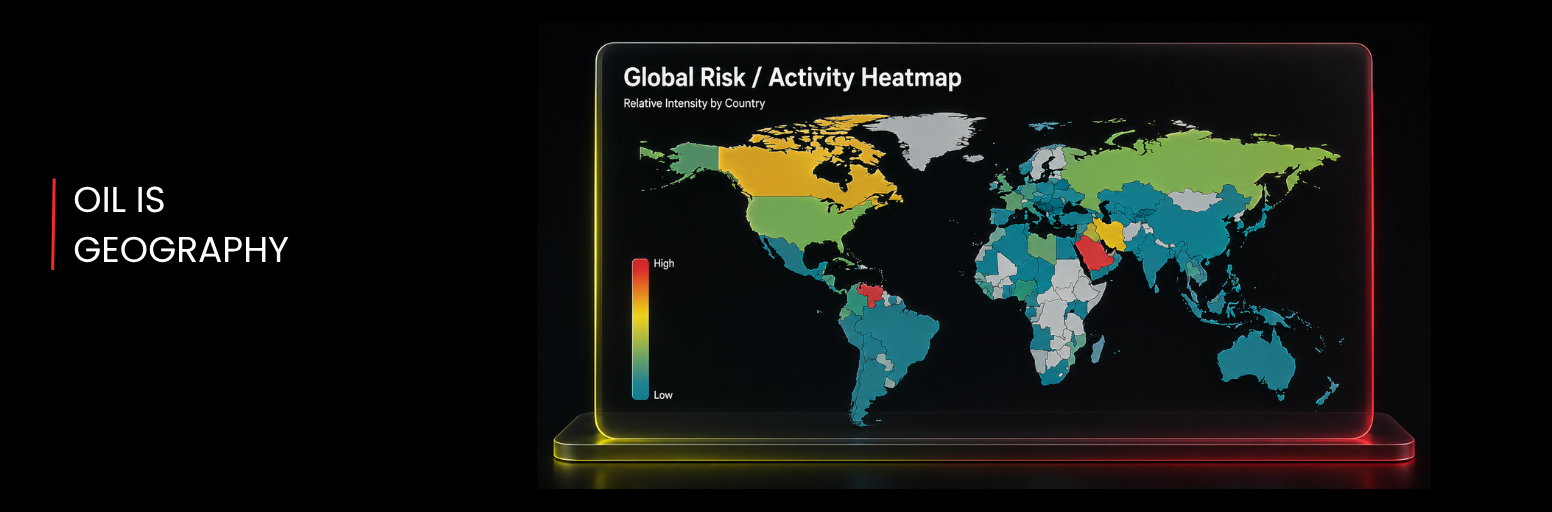
Many of the countries with the largest oil reserves are located in the Middle East and North Africa, where geopolitical risks are frequent. That makes global oil supply highly sensitive to conflict.
For traders, this matters because oil is not only a commodity.
It is a geopolitical asset.
Why the Reserve-to-Production Ratio Matters for Oil Trading
Oil reserves are limited.
That is why traders should understand the reserve-to-production ratio.
This ratio compares crude oil reserves with actual production levels. In simple terms, it estimates how many years a country or region can continue producing oil at its current pace.
As of 2025, the global reserve-to-production ratio is only around 47 years.
The world’s largest oil consumers are:
- United States: 19.95% of global consumption
- China: 15.96%
- India: 5.46%
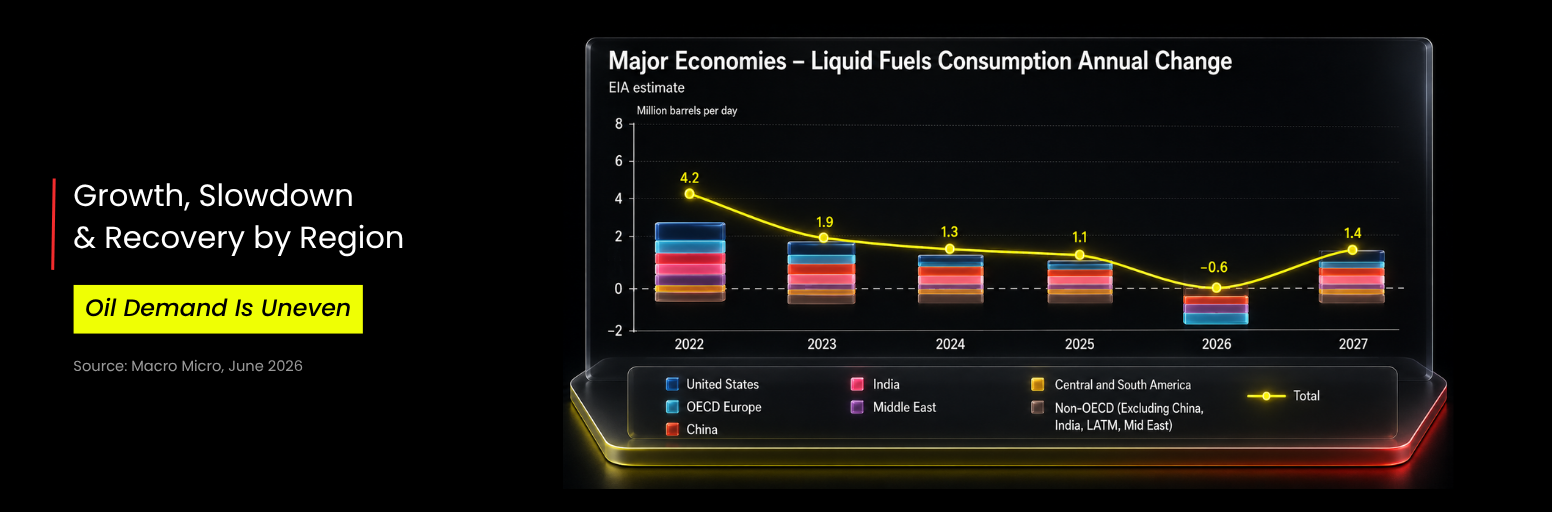
The US and China are the world’s two largest economies, so it makes sense that they consume the most oil. But their situations are very different.
The US is also the world’s largest oil producer. Thanks to the shale revolution, US daily oil output has reached around 22.8444 million barrels, surpassing Saudi Arabia’s 10.872 million barrels.
At the same time, the US consumes about 20.4637 million barrels per day, meaning it can largely support itself.
China is different.
China produces around 5.3343 million barrels per day, but consumes around 16.3705 million barrels per day.
That gap explains why China is so determined to develop green energy and reduce its dependence on imported oil.
Can the World Replace Oil in Less Than 50 Years?
It will be extremely difficult.
Due to industrial development and rising consumption, the Middle East’s reserve-to-production ratio has fallen sharply. In the late 1980s, the region had a reserve-to-production ratio of around 120 years. Today, it is less than 50 years.
In Asia Pacific, the ratio has stayed below 20 years for most of the past two decades.
That is a major vulnerability.
Asia Pacific is one of the most populated and economically active regions in the world, but its oil reserves are far below the safety line. If oil security becomes a major issue, the region’s economy could face significant pressure.
How Oil Chokepoints Move Crude Oil Prices
Oil supply is not only about production.
It is also about transportation.
Because oil reserves are unevenly distributed, global shipping routes are critical. If one major route is disrupted, oil prices can move sharply.
There are currently eight key global oil shipping chokepoints:
| Chokepoint | Daily Oil Flow |
|---|---|
| Strait of Hormuz | 18.5M barrels |
| Strait of Malacca | 16M barrels |
| Cape of Good Hope | 5.8M barrels |
| Suez Canal | 5.5M barrels |
| Bab el-Mandeb Strait | 4.8M barrels |
| Danish Straits | 3.2M barrels |
| Bosporus Strait | 2.4M barrels |
| Panama Canal | 0.9M barrels |
If any of these routes face disruption, oil prices can rise quickly.
Let’s focus on the major waterways traders need to understand.
Strait of Hormuz: The World’s Most Important Oil Chokepoint
The recent US–Iran conflict showed the world why the Strait of Hormuz matters.
Around 18.5 million to 20 million barrels of crude oil and liquid products pass through the strait every day. That accounts for:
- 31% to 34% of global seaborne oil trade
- around 20% of global oil supply
- 19.3% of global LNG trade
- 33% of global fertilizer trade
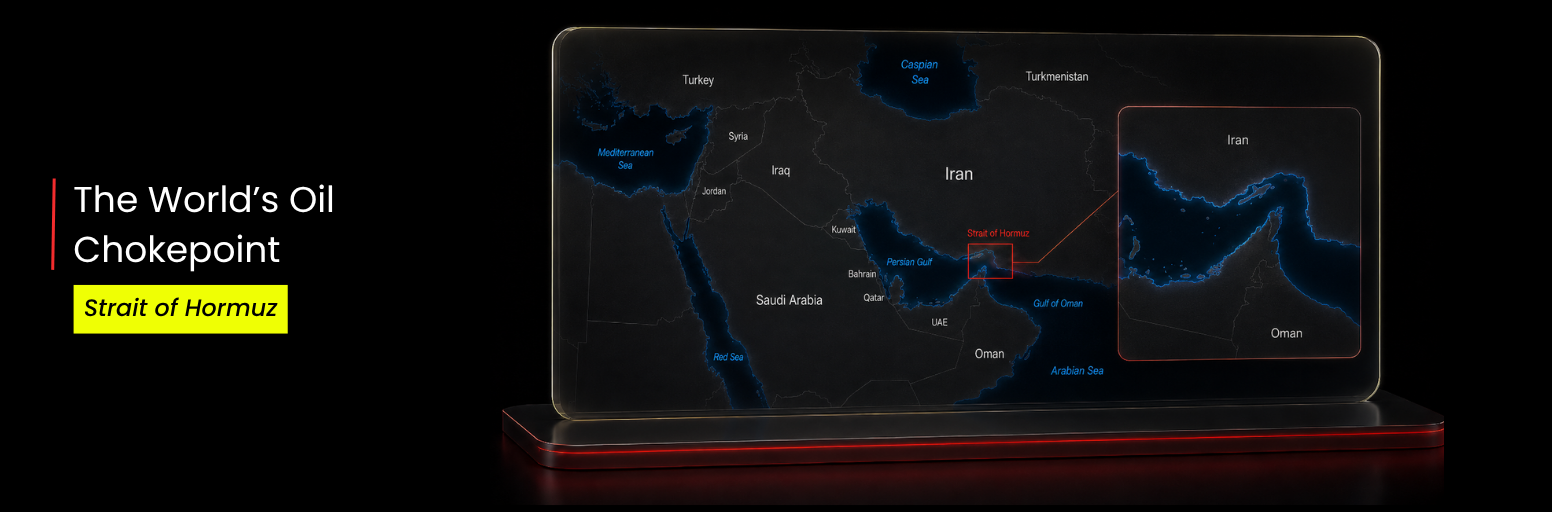
The Strait of Hormuz is the only sea passage from the Persian Gulf to the Indian Ocean.
It is around 150 km long from east to west, with an average width of only 34 km. The one-way width of the main shipping channel is just 3 km.
Most oil loading ports of Saudi Arabia, Kuwait, Iraq, Iran, Bahrain, Qatar and the UAE are located inside the Persian Gulf.
Only limited supply can bypass the strait, including:
- Saudi Arabia and UAE pipelines with combined capacity of around 6.6 million barrels per day
- oil fields in northern Iraq
Everything else needs the strait.
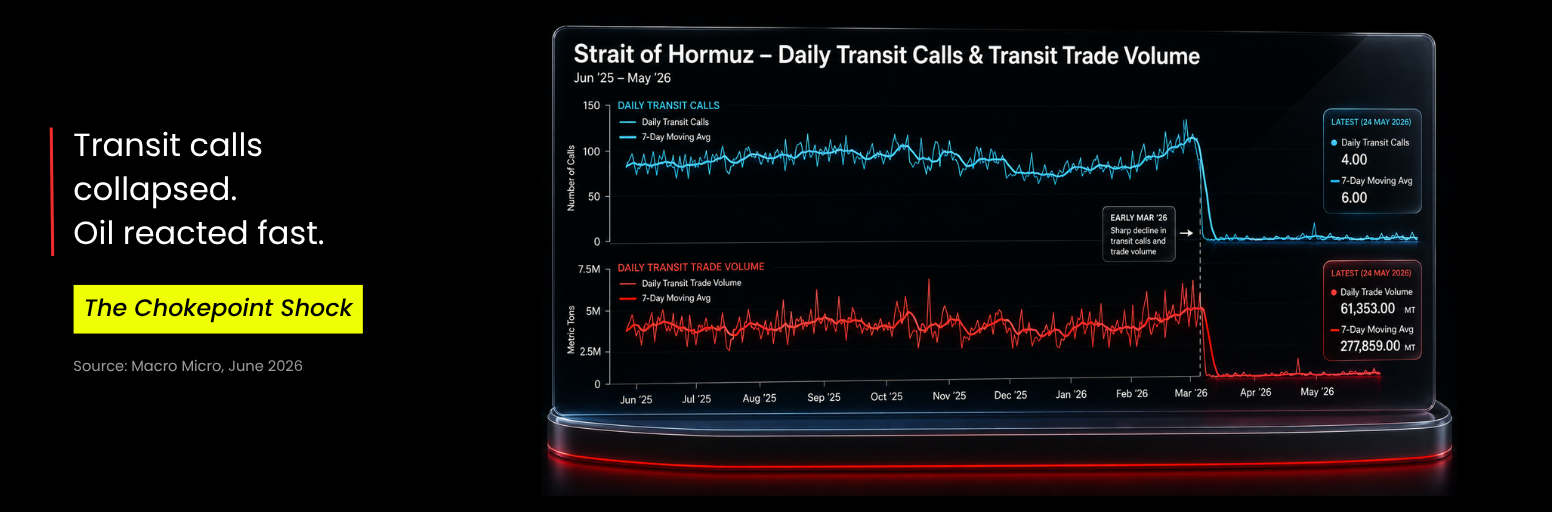
After the US–Iran conflict, daily ship traffic through the strait reportedly dropped from dozens or even hundreds of vessels to only around 4 or 5.
That is why oil prices surged.
For oil traders, the Strait of Hormuz is not just a map location.
It is one of the most important price triggers in the world.
Strait of Malacca: Asia’s Oil Supply Lifeline
The Strait of Malacca lies between the Malay Peninsula and Sumatra. It connects the Indian Ocean with the South China Sea and is one of the most important trade routes in the world.
It is around 1,080 km long and can accommodate ships of up to 300,000 tonnes.
Its widest point is around 370 km, but the narrowest section, the Phillips Channel, is only 2.7 km wide.
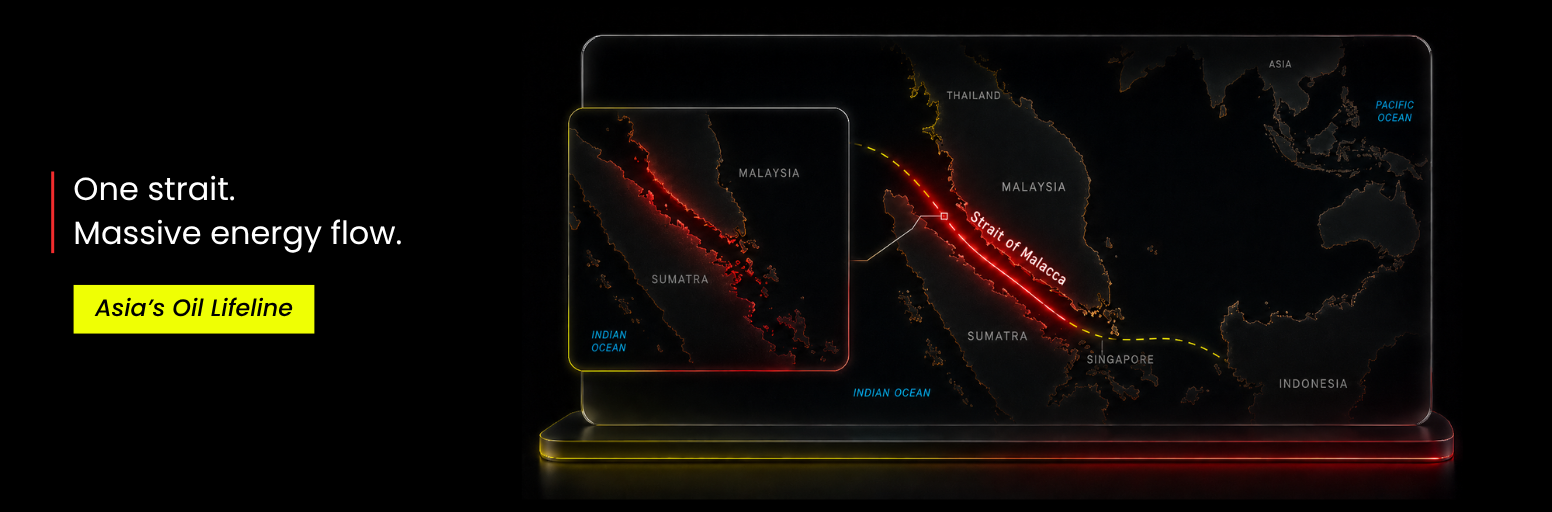
For East Asia, this strait is a lifeline.
More than 90% of crude oil consumed by major oil-importing countries such as China, Japan and South Korea passes through the Strait of Malacca.
If it is disrupted, ships can reroute through Indonesia’s Sunda Strait or Lombok-Makassar Strait. But that requires a long detour to the south and is much more expensive.
That makes Malacca one of the most important oil routes for Asia.
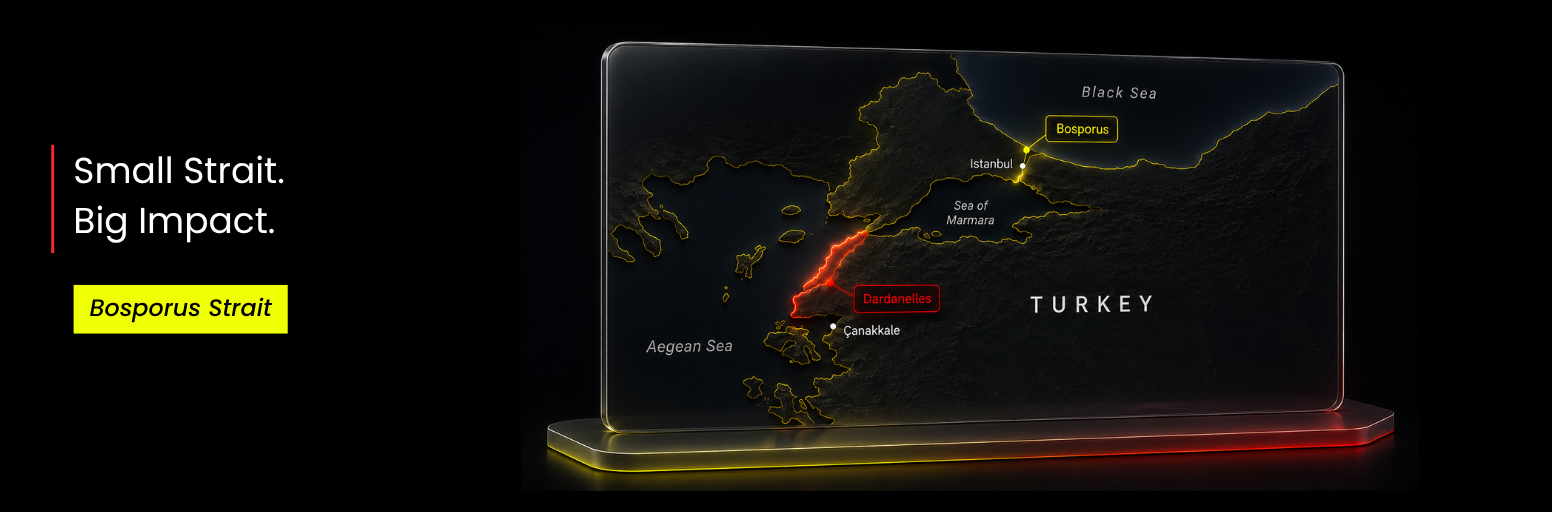
Bosporus Strait: Russia’s Key Oil Route to Europe
The Bosporus Strait in Istanbul, Turkey, is less famous than Hormuz or Malacca, but it is extremely important.
It connects the Black Sea with the Mediterranean Sea.
The strait is only 30.4 km long. Its maximum width is 3.4 km, while the narrowest point is only 708 metres.
It may be small, but it carries major strategic importance.
For Russia, the Bosporus is a key route for goods and energy exports moving toward Europe.
It also faces operational risks. In winter, heavy fog can make navigation difficult and sometimes force closures.
For traders, this means the Bosporus can quietly become a major oil and shipping risk during periods of geopolitical or weather-related disruption.
Suez Canal and Panama Canal: Strategic Routes for Oil Shipping
The Suez Canal is located in Egypt and connects the Red Sea with the Mediterranean Sea.
It is around 190 km long and about 300 metres wide.
Before the canal was built, ships traveling between Europe and Asia had to detour around the Cape of Good Hope in Africa. The Suez Canal can shorten the journey by up to 10,000 km.
But because it is located near the Middle East, it remains exposed to geopolitical risk.
During past Middle East wars, the Suez Canal was closed five times, with the longest closure lasting eight years.
The Panama Canal is located in Central America and connects the Pacific Ocean with the Atlantic Ocean.
Compared with the Middle East, the Panama Canal is located in a more stable geopolitical environment.
It is around 81.3 km long, with a maximum width of just over 300 metres.
For oil traders, both canals matter because they reduce shipping distance, lower transport costs and help stabilize global trade flows.
When these routes face disruption, shipping costs rise and oil markets react.
Oil Trading Is About More Than Price Charts
Trading oil is not like trading many traditional assets.
Oil prices are heavily affected by geopolitics, supply disruptions and shipping chokepoints. Events can happen suddenly. One moment the market is calm. The next moment, a conflict, closure or supply shock can trigger a sharp move.
That is what makes oil dangerous.
It is also what makes oil attractive to traders.
Oil is a high-volatility asset. It can create major opportunities, but it can also wipe out poorly managed positions quickly.
The key is not to blindly chase every move.
The key is to understand:
- where oil comes from
- who controls supply
- which chokepoints matter
- how geopolitics affects price
- when volatility creates opportunity
This is exactly what the D Prime Oil Trading Playbook series is designed to help traders learn.
Oil moves fast. D Prime will keep decoding what drives it, what matters next, and how traders can better read the market.
By D Prime Analysis Team
Macro and market strategy research by D Prime’s in-house analysis team.
Risk Disclosure
Trading in Securities, Futures, contracts for difference (CFDs) and other financial products carries high risks due to the rapid and unpredictable fluctuation in the value and prices of these financial instruments. This unpredictability is due to the adverse and unpredictable market movements, geopolitical events, economic data releases, and other unforeseen circumstances. You may sustain substantial losses, including losses exceeding your initial investment within a short period of time.
You are strongly advised to fully understand the nature and inherent risks of trading with the respective financial instrument before engaging in any transactions with us. When you engage in transactions with us, you acknowledge that you are aware of and accept these risks.
Disclaimer
The information contained herein is provided for general informational and educational purposes only and does not constitute investment advice, financial advice, trading advice or any other form of professional advice, a recommendation, or an offer or solicitation to buy or sell any financial instruments or engage in any trading strategy.
Trading in leveraged products such as contracts for difference (CFDs) involves a significant risk of loss and may not be suitable for all investors. Past performance is not indicative of future results. Any references to market trends, asset performance, price levels, or forward-looking statements reflect opinions or general market commentary as at the date of publication and are subject to change without notice.
This article does not take into account any individual investor’s objectives, financial situation, or risk tolerance. Readers should conduct their own independent research and seek professional advice before making any investment or trading decisions. D Prime and its affiliates make no representations or warranties about the accuracy or completeness or reliability of this information and disclaim any and all liability for any direct, indirect, incidental, consequential, or other losses or damages arising out of or in connection with the use of or reliance on any information contained herein. The above information should not be used or considered as the basis for any trading decisions or as an invitation to engage in any transaction. Do not rely on this article to replace your independent judgment.
“D Prime” is a brand name of D Prime Vanuatu Limited, a company incorporated and regulated by the Vanuatu Financial Services Commission (Company Number: 700238). The availability of products and services may vary depending on jurisdiction and applicable regulatory requirements.


