The US government is already shut down, and markets are bracing for the fallout.
With rate cuts now priced in, inflation staying sticky, and the dollar losing its edge, silver is waking up again.
Liquidity is set to flood back into the system, the same kind of macro cocktail that’s triggered massive precious metal rallies before.
But this time, the charts are hinting at something bigger.
Could silver finally break its 40-year curse and rocket toward $75?
It sounds ambitious. But so did $3,000 gold a year ago.
Silver Price Forecast 2025
Let’s start with the obvious: the white gold has been climbing steadily, supported by a weaker US dollar, rising industrial demand, and renewed safe-haven appetite.
According to multiple silver price forecasts for 2025, the metal is now flirting with levels not seen since 2011. The difference this time is the macro tension meets monetary easing.
When the Fed cuts rates, yields fall, and metals like silver shine brighter. A lower-yield environment makes non-interest-bearing assets more attractive. Combine that with government shutdown, and you’ve got a cocktail of fear, liquidity, and opportunity.
If you’ve been following the silver price outlook, you’ll notice that momentum has been building for months. Each hint of slower US growth or dovish Fed rhetoric gives the metal another leg up.
Gold vs Silver: The Long Game
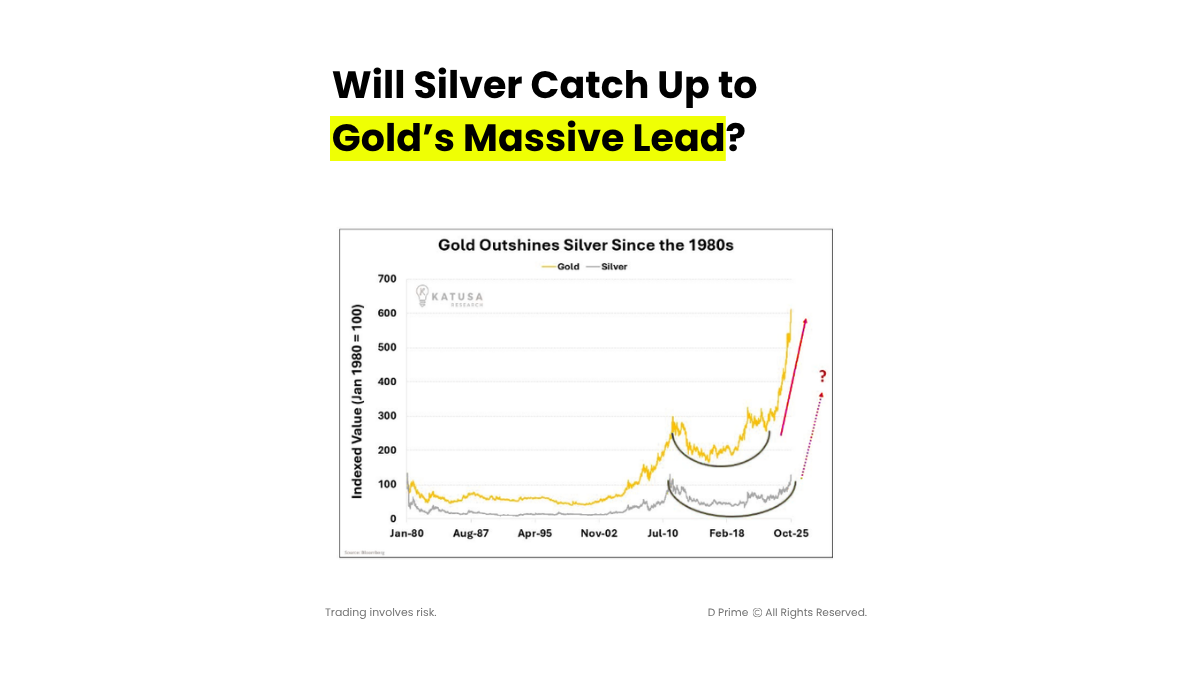
This chart shows how gold has dramatically outperformed silver since 1980. Gold’s indexed value surged nearly sevenfold, while silver lagged far behind.
But look closely, both metals show a rounding-bottom recovery pattern over the past two decades, marked by green arcs.
The first recovery came after the 2011 crash, and the second one, the one we’re living now, looks very similar.
Gold has already broken out vertically, while silver is forming a mirror pattern, possibly setting up for a delayed catch-up rally.
That dotted purple arrow is the speculative path analysts are watching, a potential mean reversion trade where silver begins to close the decades-long performance gap.
If that plays out, $75 silver might not be far-fetched, it could simply be silver’s long-overdue revenge.
Silver’s Battle with the $50 Wall
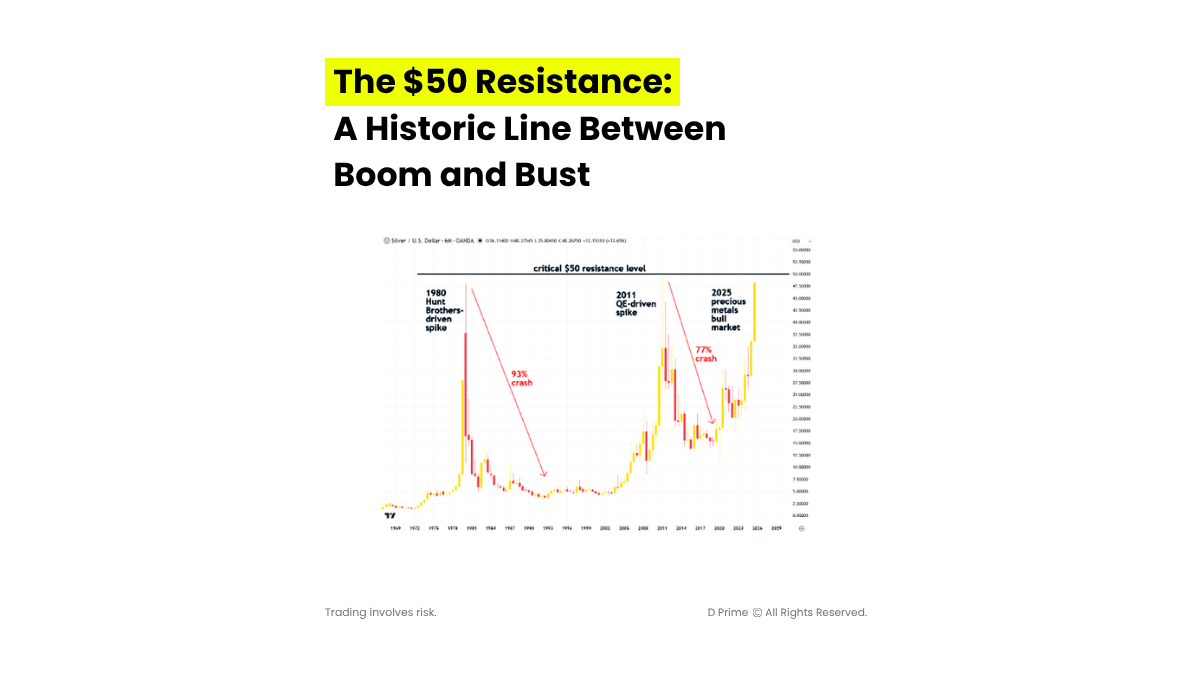
This chart tells silver’s story in one glance.
- 1980: The Hunt Brothers cornered the market, sending gold’s cheaper cousin to $50 before a 93% crash.
- 2011: Quantitative easing and dollar debasement fueled another $50 spike, followed by a 77% crash.
- 2025: Now we’re entering what analysts call a “precious metals bull market 3.0.”
The pattern is clear: silver builds massive bases, tests $50, and either crashes, or breaks into a new era.
The current rally has few differences that make bulls hopeful:
- No artificial manipulation this time (unlike 1980).
- Structural industrial demand from solar, EVs, and electronics.
- Macro alignment: rate cuts, inflation risk, and fiscal strain.
If the precious metal can decisively clear that $50 resistance, momentum could easily carry it toward the $75 psychological level.
It’s not a random number, it’s roughly a 50% breakout move above the last cycle’s high, and that’s well within historical volatility.
The Fed Factor: Rate Cuts Could Light the Fuse
Markets are now pricing in two more rate cuts in 2025, according to FedWatch data. For silver, that’s rocket fuel.
Lower interest rates weaken the US dollar, and since precious metals are priced in dollars, that’s an instant tailwind.
Every major silver price forecast since the 1980s shows the same pattern: when the Fed loosens, metals rally. When it tightens, they cool. This time, we’re entering the easing phase again, but with higher global debt, fragile growth, and political chaos.
That’s not a normal backdrop. That’s a perfect storm for silver.
Can Silver Really Hit $75?
$75 isn’t guaranteed, but it’s plausible.
The precious metal touched nearly $50 in 2011, and a proportional move today (adjusted for inflation and dollar weakness) lands near $70–$80.
For that to happen, we’d need:
- Multiple rate cuts reducing yields.
- Persistent inflation keeping metals attractive.
- ETF inflows and renewed speculative buying.
- Industrial expansion sustaining real demand.
If these stars align, silver could finally reclaim its throne as the people’s metal.
When Fear Meets Liquidity, Silver Shines
Between government shutdown, expected rate cuts, and historic underperformance versus gold, silver’s setup for 2025 looks explosive.
Will it reach $75? That depends on how long this macro tension lasts.
But one thing’s certain, silver’s sleeping giant moment is near. And when it wakes, the market might need sunglasses.
Risk Disclosure
Securities, Futures, CFDs and other financial products involve high risks due to the rapid and unpredictable fluctuation in the value and prices of these underlying financial instruments. This unpredictability is due to the adverse and unpredictable market movements, geopolitical events, economic data releases, and other unforeseen circumstances. You may sustain substantial losses including losses exceeding your initial investment within a short period of time.
You are strongly advised to fully understand the nature and inherent risks of trading with the respective financial instrument before engaging in any transactions with us. When you engage in transactions with us, you acknowledge that you are aware of and accept these risks. You should conduct your own research and consult with an independent qualified financial advisor or professional before making any financial, trading or investment decisions.
Disclaimer
This information contained in this blog is for general informational purposes only and should not be considered as financial, investment, legal, tax or any other form of professional advice, recommendation, an offer, or an invitation to buy or sell any financial instruments. The content herein, including but not limited to data, analyses and market commentary, is presented based on internal records and/or publicly available information and may be subject to change or revision at anytime without notice and it does not consider any specific recipient’s investment objectives or financial situation. Past performance references are not reliable indicators of future performance.
D Prime and its affiliates make no representations or warranties about the accuracy or completeness of this information and disclaim any and all liability for any direct, indirect, incidental, consequential, or other losses or damages arising out of or in connection with the use of or reliance on any information contained in this blog. The above information should not be used or considered as the basis for any trading decisions or as an invitation to engage in any transaction.
D Prime does not guarantee the accuracy or completeness of this report and assumes no responsibility for any losses resulting from the use of this report. Do not rely on this report to replace your independent judgment. You should conduct your own research and consult with an independent qualified financial advisor or professional before making any financial, trading or investment decisions.


