
1. Daily technical analysis of selected currency pairs
USD/SGD Bullish
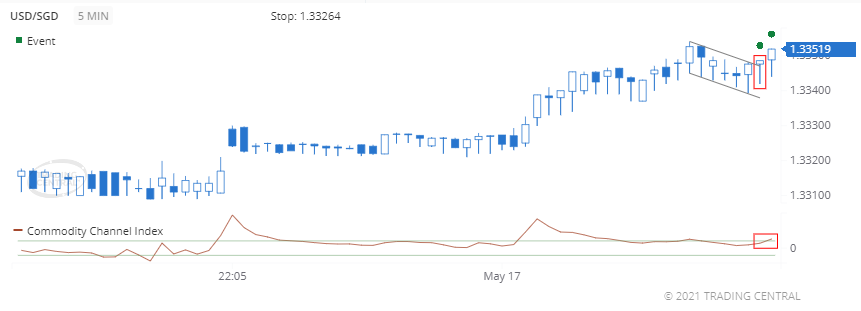
Image Features: forms “Hammer” pattern
Target
Opportunity recognized 2021 May 17 for the period of up to 12 hours
+0.00033 (33 pips) price change since the Technical Event at 1.33486
Technical Analysis
We found a pattern called Hammer on 2021 May 17 at 01:50 GMT on a 5 minute chart suggesting the outlook is bullish for up to 12 hours.
The CCI triggered a bullish signal on 2021 May 17 at 01:55 GMT by crossing above the +100% level.
AUD/CAD Bearish
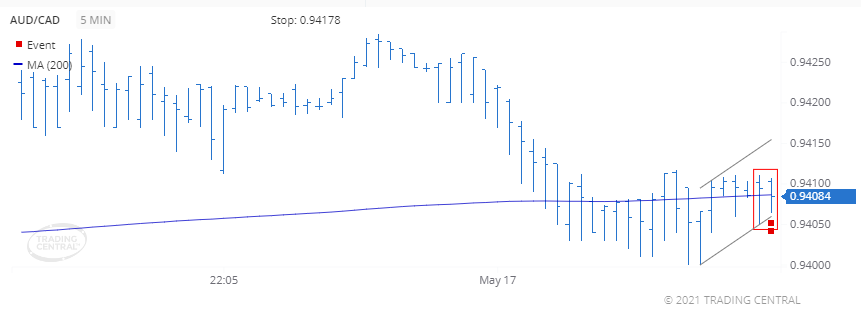
Image Features: forms “Inside Bar (Bearish)” pattern
Target
Opportunity recognized 2021 May 17 for the period of up to 12 hours
0.00000 (0 pips) price change since the Technical Event at 0.94084
Technical Analysis
We found a pattern called Inside Bar (Bearish) on 2021 May 17 at 01:55 GMT on a 5 minute chart suggesting the outlook is bearish for up to 12 hours.
The price crossed below its moving average on 2021 May 17 at 01:55 GMT signaling a new downtrend has been established.
2. Daily Analyst’s View
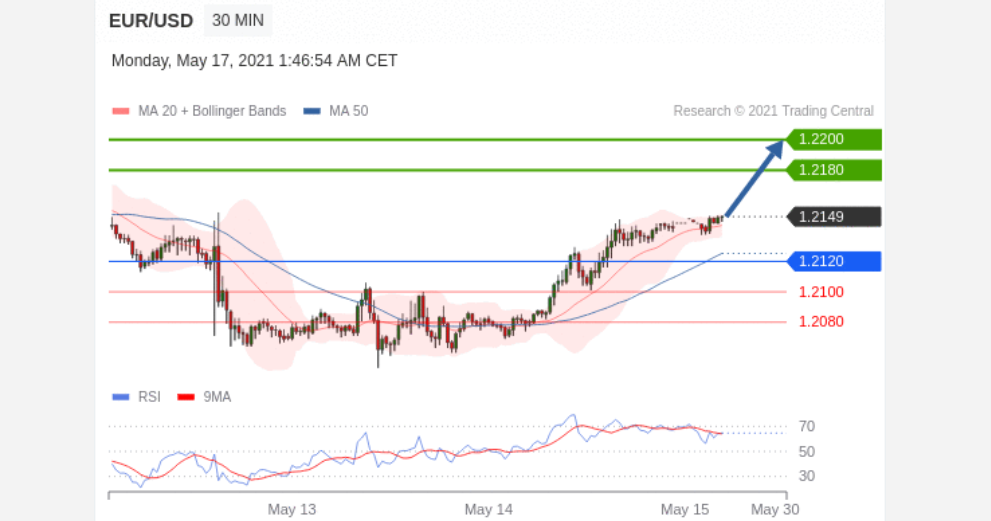
EUR/USD
may rise 32 – 52 pips
Pivot
1.2120
Our preference
Long positions above 1.2120 with targets at 1.2180 & 1.2200 in extension.
Alternative scenario
Below 1.2120 look for further downside with 1.2100 & 1.2080 as targets.
Comment
The RSI is bullish and calls for further advance.
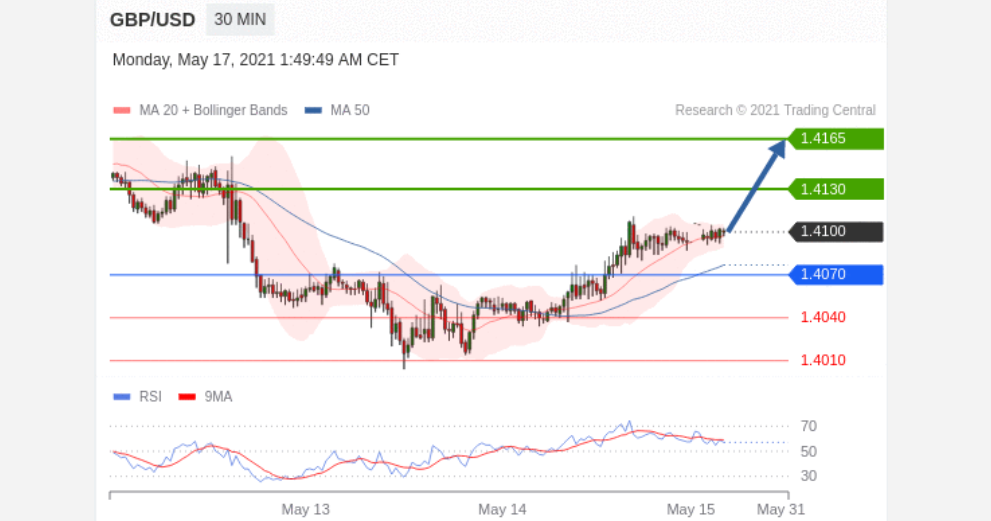
GBP/USD
may rise 30 – 65 pips
Pivot
1.4070
Our preference
Long positions above 1.4070 with targets at 1.4130 & 1.4165 in extension.
Alternative scenario
Below 1.4070 look for further downside with 1.4040 & 1.4010 as targets.
Comment
The RSI advocates for further upside.
USD/CAD
may fall 37 – 57 pips
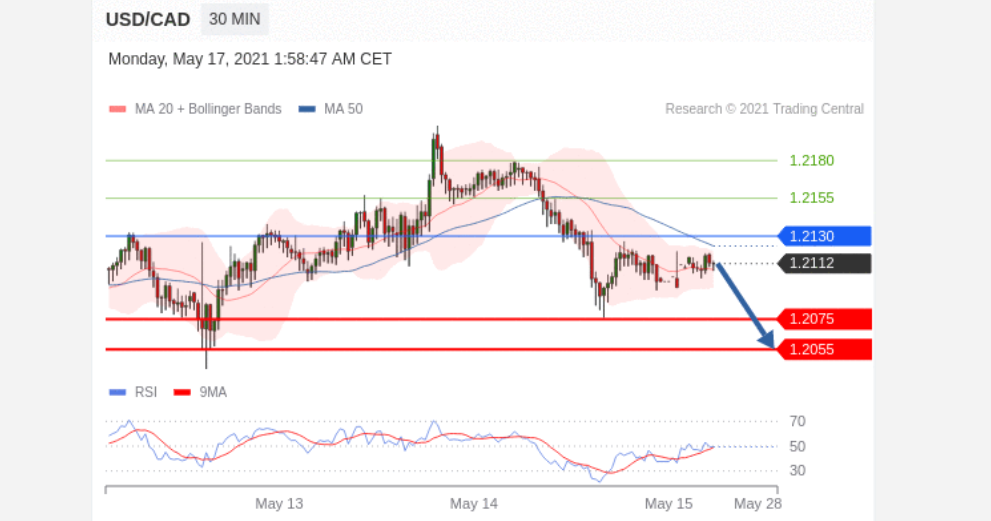
Pivot
1.2130
Our preference
Short positions below 1.2130 with targets at 1.2075 & 1.2055 in extension.
Alternative scenario
Above 1.2130 look for further upside with 1.2155 & 1.2180 as targets.
Comment
As long as the resistance at 1.2130 is not surpassed, the risk of the break below 1.2075 remains high.
Gold
may rise to 1855.00 – 1865.00
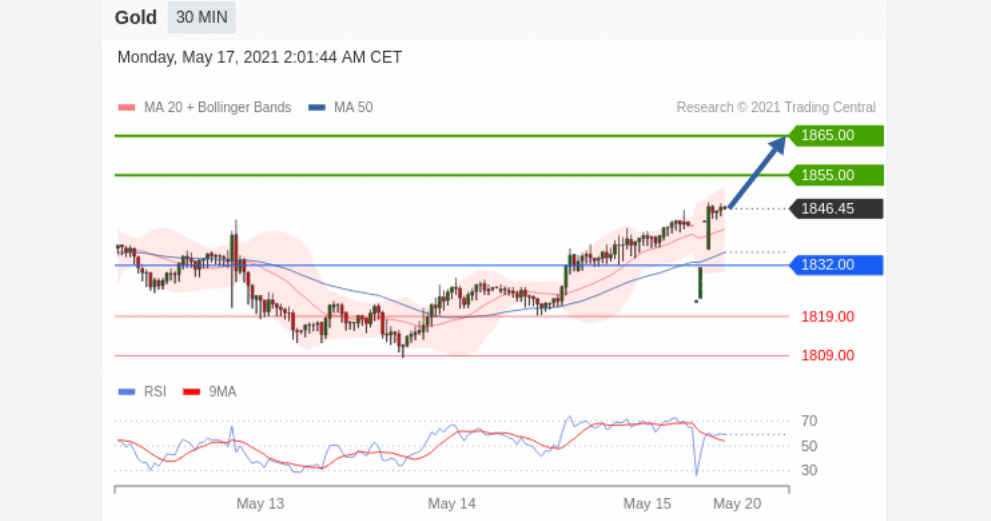
Pivot
1832.00
Our preference
Long positions above 1832.00 with targets at 1855.00 & 1865.00 in extension.
Alternative scenario
Below 1832.00 look for further downside with 1819.00 & 1809.00 as targets.
Comment
The RSI is bullish and calls for further advance.
Crude Oil (WTI)
may rise to 65.95 – 66.60
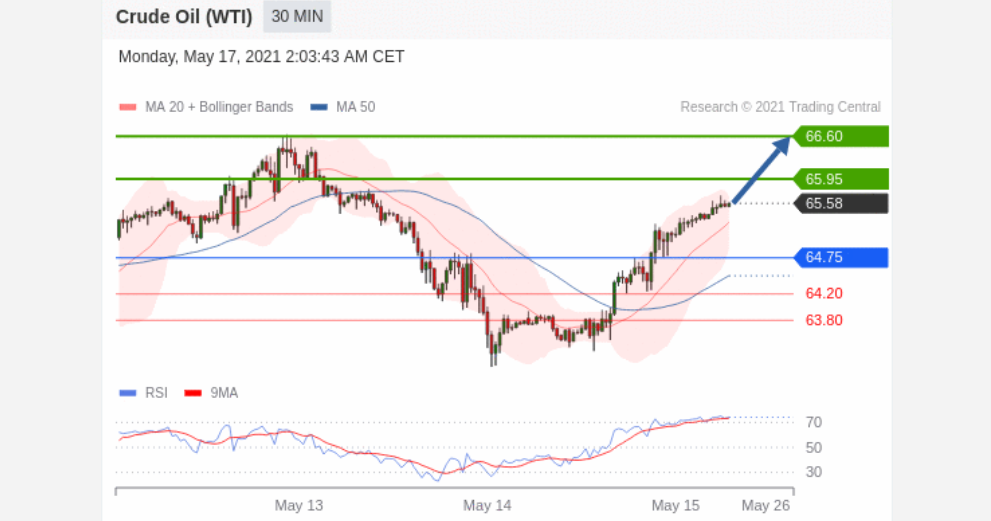
Pivot
64.75
Our preference
Long positions above 64.75 with targets at 65.95 & 66.60 in extension.
Alternative scenario
Below 64.75 look for further downside with 64.20 & 63.80 as targets.
Comment
The RSI is bullish and calls for further upside.
S&P 500 (CME)
may rise to 4185.00 – 4220.00
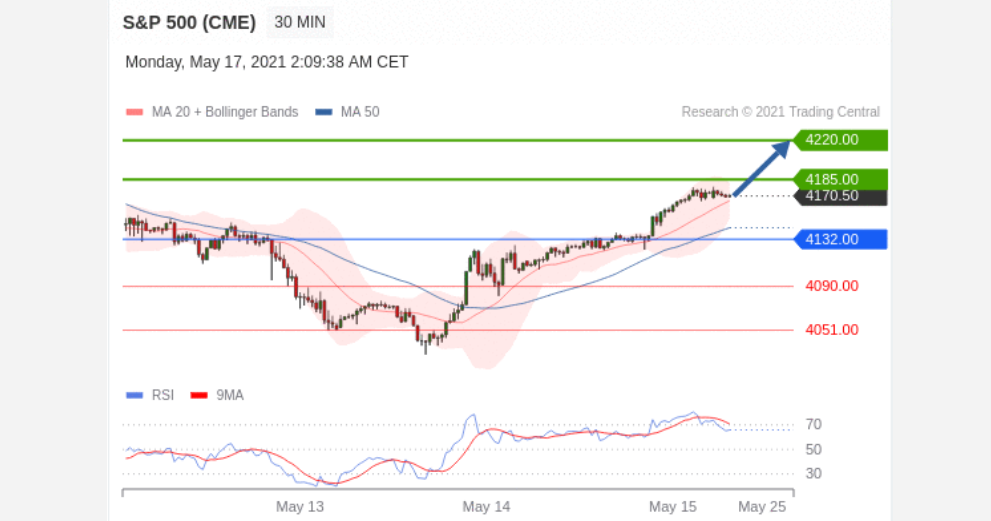
Pivot
4132.00
Our preference
Long positions above 4132.00 with targets at 4185.00 & 4220.00 in extension.
Alternative scenario
Below 4132.00 look for further downside with 4090.00 & 4051.00 as targets.
Comment
The RSI is mixed with a bullish bias.
Nasdaq 100 (CME)
may rise to 13525.00 – 13650.00
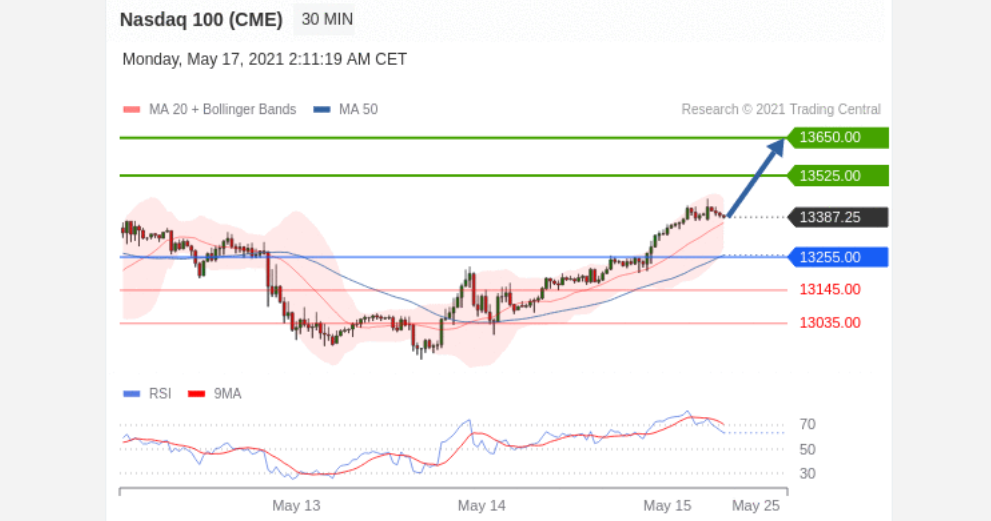
Pivot
13255.00
Our preference
Long positions above 13255.00 with targets at 13525.00 & 13650.00 in extension.
Alternative scenario
Below 13255.00 look for further downside with 13145.00 & 13035.00 as targets.
Comment
The RSI is mixed to bullish.
Hang Seng (HKFE)
may rise to 28265.00 – 28420.00
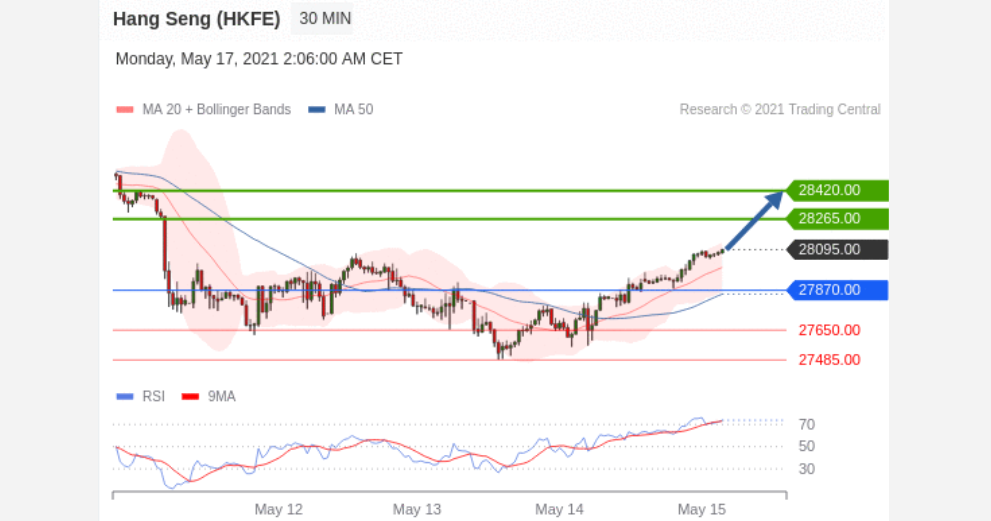
Pivot
27870.00
Our preference
Long positions above 27870.00 with targets at 28265.00 & 28420.00 in extension.
Alternative scenario
Below 27870.00 look for further downside with 27650.00 & 27485.00 as targets.
Comment
The RSI shows upside momentum.
Disclaimer:
This report is prepared and published by Trading Central for all clients of Doo Prime. As a third-party indicator tool, Trading Central is only for your strategic reference during the investment process and does not constitute advice or a recommendation by Doo Prime or Trading Central. Neither Doo Prime nor Trading Central are responsible to bear the relevant legal liabilities for the investment risks arising from your use of this report to make buying and selling decisions.

