
1. Daily technical analysis of selected currency pairs
AUD/JPY Bearish

Image Features: forms “Outside Bar (Bearish)” pattern
Target
Opportunity recognized 2022 Mar 24 for the period of up to 12 hours
+0.062 (6.2 pips) price change since the Technical Event at 90.780
Technical Analysis
We found a pattern called Outside Bar (Bearish) on 2022 Mar 24 at 00:30 GMT on a 15 minute chart suggesting the outlook is bearish for up to 12 hours.
On 2022 Mar 23 at 22:15 GMT, the 4-bar Moving Average crossed below the 9-bar MA which crossed below the 18-bar MA, signaling a new downtrend has been established.
CAD/JPY Bullish

Image Features: forms “Continuation Diamond (Bullish)” pattern
Target
Opportunity recognized 2022 Feb 23 for the period of up to 2 weeks
+5.681 (568.1 pips) price change since the Technical Event at 90.449
Technical Analysis
We found a pattern called Continuation Diamond (Bullish) on 2022 Feb 23 at 09:00 GMT on a 4 hour chart, providing a target price for up to 2 weeks in the range of 92.800 to 93.300.
The price crossed above its moving average on 2022 Mar 10 at 17:00 GMT signaling a new uptrend has been established.
2. Daily Analyst’s View
EUR/USD
may fall 26 – 46 pips

Pivot
1.1025
Our preference
Short positions below 1.1025 with targets at 1.0980 & 1.0960 in extension.
Alternative scenario
Above 1.1025 look for further upside with 1.1040 & 1.1055 as targets.
Comment
As long as 1.1025 is resistance, look for choppy price action with a bearish bias.
GBP/USD
may fall 36 – 56 pips

Pivot
1.3240
Our preference
Short positions below 1.3240 with targets at 1.3170 & 1.3150 in extension.
Alternative scenario
Above 1.3240 look for further upside with 1.3260 & 1.3280 as targets.
Comment
As long as the resistance at 1.3240 is not surpassed, the risk of the break below 1.3170 remains high.
USD/CAD
may fall 31 – 51 pips

Pivot
1.2600
Our preference
Short positions below 1.2600 with targets at 1.2530 & 1.2510 in extension.
Alternative scenario
Above 1.2600 look for further upside with 1.2620 & 1.2640 as targets.
Comment
The RSI advocates for further downside.
Gold
may rise to 1955.00 – 1963.00

Pivot
1933.00
Our preference
Long positions above 1933.00 with targets at 1955.00 & 1963.00 in extension.
Alternative scenario
Below 1933.00 look for further downside with 1924.00 & 1916.00 as targets.
Comment
The RSI is bullish and calls for further advance.
Crude Oil (WTI)
may rise to 117.00 – 119.70
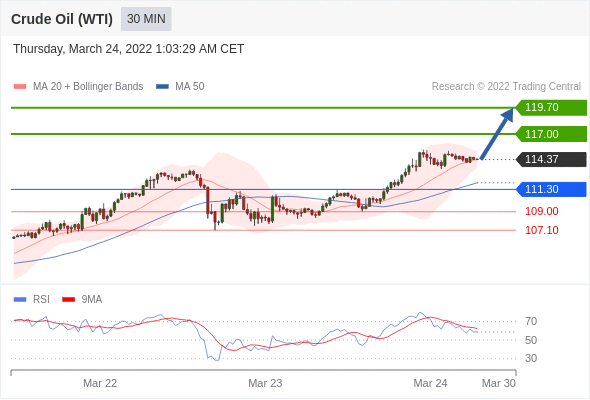
Pivot
111.30
Our preference
Long positions above 111.30 with targets at 117.00 & 119.70 in extension.
Alternative scenario
Below 111.30 look for further downside with 109.00 & 107.10 as targets.
Comment
Even though a continuation of the consolidation cannot be ruled out, its extent should be limited.
S&P 500 (CME)
may fall to 4415.00 – 4433.00
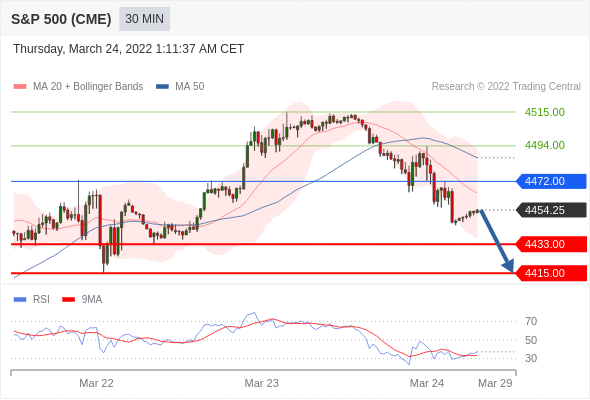
Pivot
4472.00
Our preference
Short positions below 4472.00 with targets at 4433.00 & 4415.00 in extension.
Alternative scenario
Above 4472.00 look for further upside with 4494.00 & 4515.00 as targets.
Comment
The RSI is bearish and calls for further downside.
Nasdaq 100 (CME)
may fall to 14295.00 – 14360.00
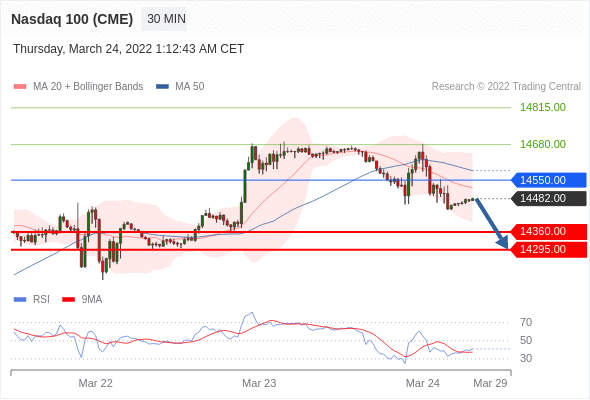
Pivot
14470.00
Our preference
Long positions above 14470.00 with targets at 14815.00 & 14900.00 in extension.
Alternative scenario
Below 14470.00 look for further downside with 14295.00 & 14180.00 as targets.
Comment
The next resistances are at 14815.00 and then at 14900.00.
Hang Seng (HKFE)
may rise to 22400.00 – 22800.00

Pivot
21690.00
Our preference
Long positions above 21690.00 with targets at 22400.00 & 22800.00 in extension.
Alternative scenario
Below 21690.00 look for further downside with 21480.00 & 21080.00 as targets.
Comment
A support base at 21690.00 has formed and has allowed for a temporary stabilisation.
Disclaimer:
This report is prepared and published by Trading Central for all clients of Doo Prime. As a third-party indicator tool, Trading Central is only for your strategic reference during the investment process and does not constitute advice or a recommendation by Doo Prime or Trading Central. Neither Doo Prime nor Trading Central are responsible to bear the relevant legal liabilities for the investment risks arising from your use of this report to make buying and selling decisions.

