
1. Daily technical analysis of selected currency pairs
EUR/JPY Bullish
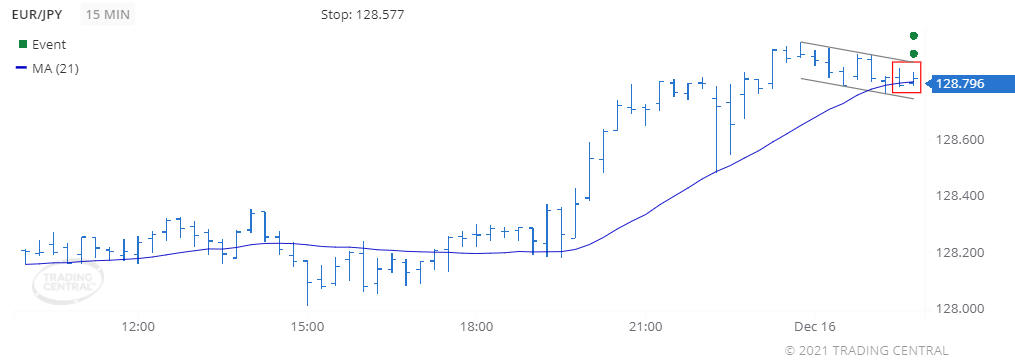
Image Features: forms “Inside Bar (Bullish)” pattern
Target
Opportunity recognized 2021 Dec 16 for the period of up to 12 hours
-0.021 (2.1 pips) price change since the Technical Event at 128.817
Technical Analysis
We found a pattern called Inside Bar (Bullish) on 2021 Dec 16 at 01:45 GMT on a 15 minute chart suggesting the outlook is bullish for up to 12 hours.
The price crossed above its moving average on 2021 Dec 16 at 01:45 GMT signaling a new uptrend has been established.
CAD/JPY Bearish
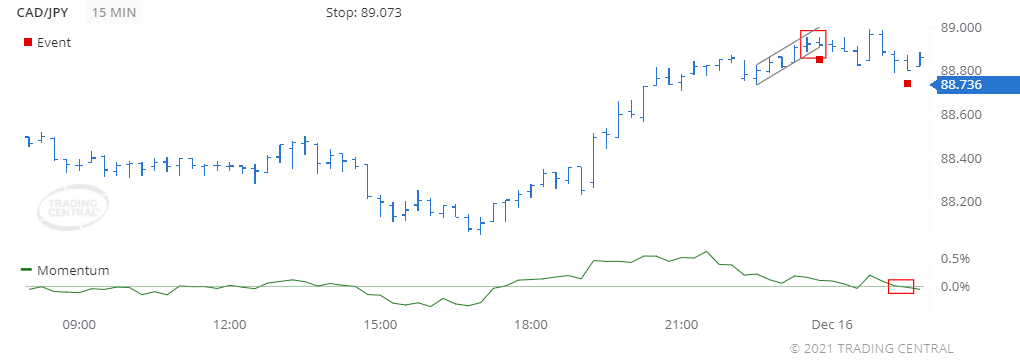
Image Features: forms “Inside Bar (Bearish)” pattern
Target
Opportunity recognized 2021 Dec 15 for the period of up to 12 hours
-0.184 (18.4 pips) price change since the Technical Event at 88.920
Technical Analysis
We found a pattern called Inside Bar (Bearish) on 2021 Dec 15 at 23:45 GMT on a 15 minute chart suggesting the outlook is bearish for up to 12 hours.
The Momentum oscillator crossed below 0 on 2021 Dec 16 at 01:30 GMT, thereby signaling a new accelerating downtrend.
2. Daily Analyst’s View
EUR/USD
may rise 18 – 33 pips
Pivot
1.1265
Our preference
Long positions above 1.1265 with targets at 1.1310 & 1.1325 in extension.
Alternative scenario
Below 1.1265 look for further downside with 1.1245 & 1.1230 as targets.
Comment
The RSI advocates for further upside.
GBP/USD
may rise 20 – 40 pips
Pivot
1.3230
Our preference
Long positions above 1.3230 with targets at 1.3280 & 1.3300 in extension.
Alternative scenario
Below 1.3230 look for further downside with 1.3205 & 1.3185 as targets.
Comment
Technically the RSI is above its neutrality area at 50.
USD/CAD
may fall 22 – 52 pips
Pivot
1.2875
Our preference
Short positions below 1.2875 with targets at 1.2810 & 1.2780 in extension.
Alternative scenario
Above 1.2875 look for further upside with 1.2905 & 1.2935 as targets.
Comment
A break below 1.2810 would trigger a drop towards 1.2780.
Gold
may rise to 1790.00 – 1795.00
Pivot
1768.00
Our preference
Long positions above 1768.00 with targets at 1790.00 & 1795.00 in extension.
Alternative scenario
Below 1768.00 look for further downside with 1760.00 & 1752.00 as targets.
Comment
The RSI is bullish and calls for further advance.
Crude Oil (WTI)
may rise to 72.30 – 73.00
Pivot
70.65
Our preference
Long positions above 70.65 with targets at 72.30 & 73.00 in extension.
Alternative scenario
Below 70.65 look for further downside with 70.00 & 69.40 as targets.
Comment
The next resistances are at 72.30 and then at 73.00.
S&P 500 (CME)
may rise to 4722.00 – 4750.00
Pivot
4674.00
Our preference
Long positions above 4674.00 with targets at 4722.00 & 4750.00 in extension.
Alternative scenario
Below 4674.00 look for further downside with 4642.00 & 4602.00 as targets.
Comment
The RSI shows upside momentum.
Nasdaq 100 (CME)
may rise to 16440.00 – 16550.00
Pivot
16130.00
Our preference
Long positions above 16130.00 with targets at 16440.00 & 16550.00 in extension.
Alternative scenario
Below 16130.00 look for further downside with 15995.00 & 15750.00 as targets.
Comment
The RSI is bullish and calls for further advance.
Hang Seng (HKFE)
may fall to 22750.00 – 23000.00
Pivot
23385.00
Our preference
Short positions below 23385.00 with targets at 23000.00 & 22750.00 in extension.
Alternative scenario
Above 23385.00 look for further upside with 23735.00 & 24040.00 as targets.
Comment
The RSI is bearish and calls for further downside.
Disclaimer:
This report is prepared and published by Trading Central for all clients of Doo Prime. As a third-party indicator tool, Trading Central is only for your strategic reference during the investment process and does not constitute advice or a recommendation by Doo Prime or Trading Central. Neither Doo Prime nor Trading Central are responsible to bear the relevant legal liabilities for the investment risks arising from your use of this report to make buying and selling decisions.