
Bitcoin has been here before. The doubters, the dips, and then out of nowhere, a monster rally that silences the noise. But this time, there’s something different behind the move. Something bigger. It isn’t just hype or halving talk. It’s global money supply. And it might be telling us where Bitcoin is headed next.
Global liquidity is rising. And history shows that when money supply surges, Bitcoin doesn’t just follow, it explodes.
In this article, we’ll unpack why the M2 money supply is becoming the most important chart in crypto. How it has historically led Bitcoin by 12 weeks? And why this could be the moment that sets the stage for a run toward $150,000.
Let’s explore what’s going on and why traders and investors should be paying attention now.
What Is M2 and Why It Leads Bitcoin
M2 is a measure of the money supply that includes cash, checking deposits, and easily convertible near-money. In simple terms, when M2 rises, there’s more liquidity floating around.
Historically, Bitcoin tends to follow this liquidity. More money in the system often means more risk appetite, more dollar debasement, and more interest in alternative assets like BTC.
History of Bitcoin and M2
Remember 2020? The Federal Reserve launched a massive stimulus, M2 spiked and Bitcoin shot from $10K to nearly $70K within months. The same pattern played out in previous cycles as well:
- 2017: Chinese capital controls and dollar weakness lifted BTC.
- 2020-2021: COVID stimulus poured fuel on the fire.
- Now: Global M2 is rising again, but this time, with more players at the table.
Bitcoin doesn’t always move because of tech innovation or halving narratives. Sometimes it just follows the money. Literally.
Why This Time Could Be Even Bigger
This cycle isn’t just about liquidity. It’s also about access.
- Spot Bitcoin ETFs are now live.
- Institutions are slowly warming up.
- Wall Street is treating BTC less like a meme, and more like a macro hedge.
Combine rising M2 with new inflows from traditional finance, and you’ve got a powerful setup. The 12-week lead from M2 could be more accurate than ever before.
And don’t forget the halving effect: supply-side pressure is real. Add that to surging demand, and you’ve got the makings of something historic.
Bitcoin as the Macro Hedge
With fiat printing back on the table and fiscal deficits ballooning, Bitcoin is once again being seen as an insurance policy.
- It’s borderless.
- It’s finite.
- It’s outside the traditional system.
M2 rising often signals future inflation. Gold used to be the answer. But Bitcoin is leaner, faster, and easier to move.
Investors no longer need to ship bars of gold or hedge through bonds. They can click into BTC with a few taps and many already are.
Psychological Levels Matter
The market isn’t just moved by logic. It’s moved by emotion.
- $100K is a huge psychological milestone.
- Once BTC breaks its previous high (~$110K), momentum traders will likely pile in.
- The next level to watch? $150K.
Don’t underestimate the power of FOMO once price discovery kicks in.
The Chart That Says It All
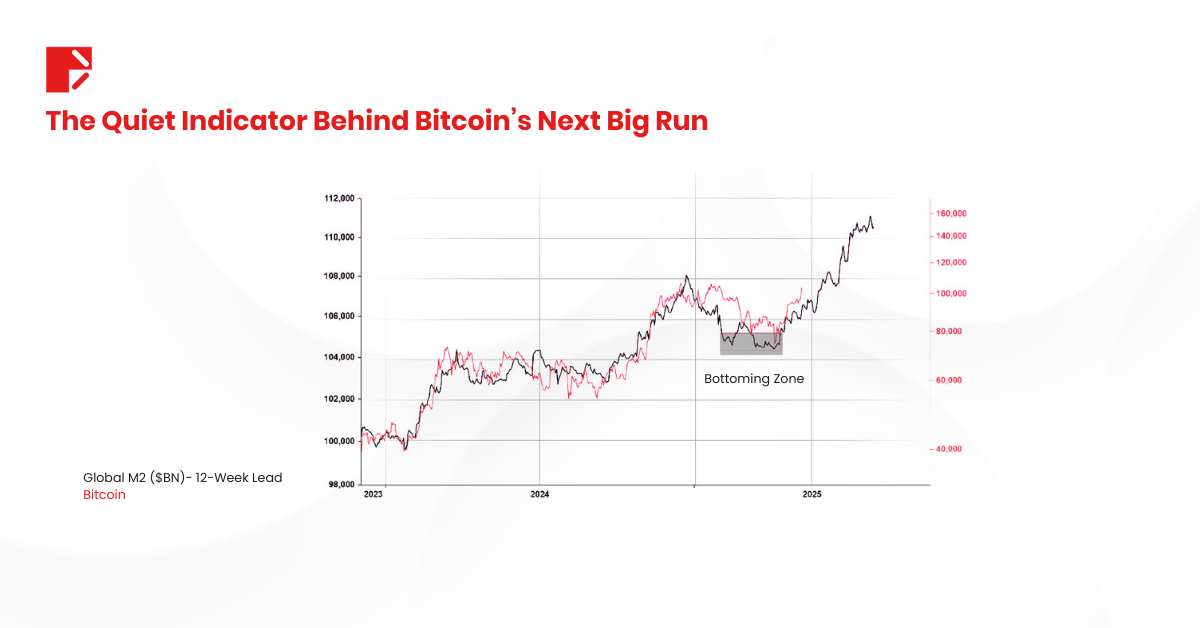
This chart tells a clean story: M2 leads, Bitcoin follows. The last three major rallies were preceded by M2 spikes. Today’s M2 is not just rising, it’s surging.
If the pattern repeats, BTC at $150K could be just a matter of time.
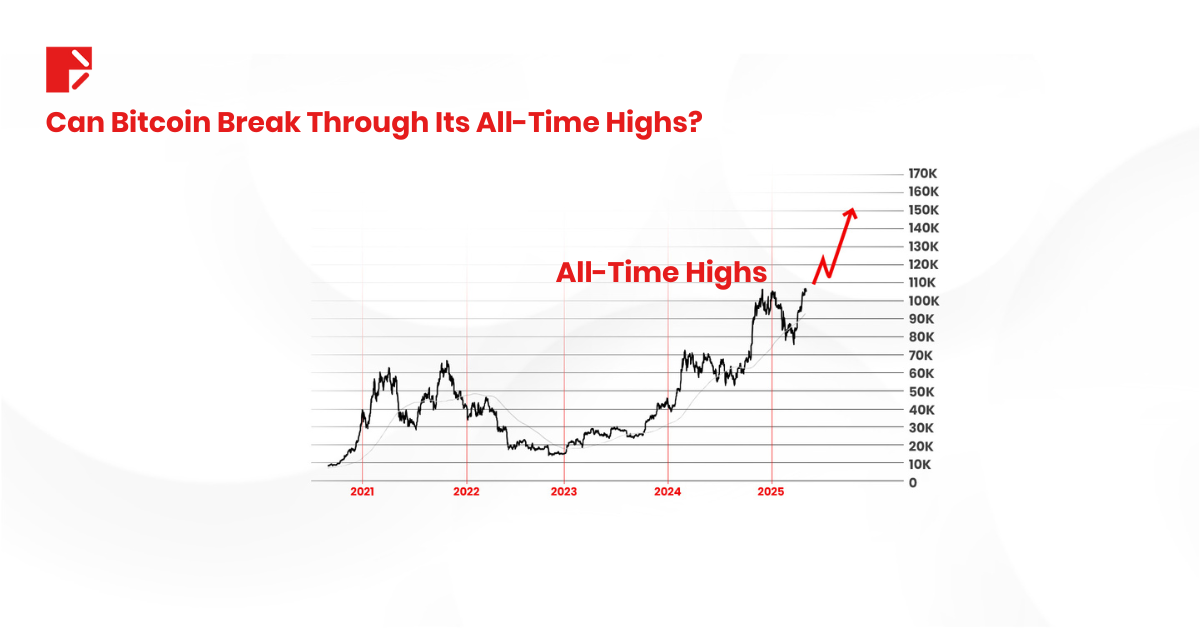
Bitcoin Technical Analysis
While macro drivers like M2 build the fundamental case, the chart tells us when the market is ready and right now, Bitcoin’s chart is starting to line up beautifully.
BTC is currently testing its all-time highs, and price action is coiling just below that ceiling. A clean break above the $110K mark would likely open the door toward $140K–$150K, fueled by breakout momentum and narrative alignment.
It’s always powerful when the chart confirms what the macro setup suggests. That’s when price, story, and sentiment all click and the result could potentially be explosive.
Risks and Reality Checks
Of course, it’s not all sunshine.
- Regulations could spook the market.
- ETF inflows could stall.
- Macro shocks (like war or policy shifts) could derail sentiment.
But these are short-term risks. The long-term picture remains intact if liquidity keeps rising and BTC maintains its position as the top digital store of value.
What Traders Should Be Watching
If you’re looking to get strategic:
- Follow global M2 data releases (China, US, EU).
- Watch ETF flows and whale wallets.
- Use technical analysis to time entries: breakouts, moving averages, volume spikes.
- Don’t forget sentiment indicators like the Fear & Greed Index.
This isn’t the time to trade blindly. It’s the time to observe and prepare.
Key Takeaway: Watch the Money
Bitcoin doesn’t move in a vacuum. It reacts to the world around it especially when that world is flooded with liquidity.
The chart doesn’t promise $150K. But it paints a path. And that path has been right before.
M2 is flashing green. Bitcoin is warming up. History might just be repeating itself.
Are you ready to ride the next wave? Click here
Risk Disclosure
Securities, Futures, CFDs and other financial products involve high risks due to the fluctuation in the value and prices of the underlying financial instruments. Due to the adverse and unpredictable market movements, large losses exceeding your initial investment could incur within a short period of time.
Please make sure you fully understand the risks of trading with the respective financial instrument before engaging in any transactions with us. You should seek independent professional advice if you do not understand the risks explained herein.
Disclaimer
This information contained in this blog is for general reference only and is not intended as investment advice, a recommendation, an offer, or an invitation to buy or sell any financial instruments. It does not consider any specific recipient’s investment objectives or financial situation. Past performance references are not reliable indicators of future performance. Doo Prime and its affiliates make no representations or warranties about the accuracy or completeness of this information and accept no liability for any losses or damages resulting from its use or from any investments made based on it.
The above information should not be used or considered as the basis for any trading decisions or as an invitation to engage in any transaction. Doo Prime does not guarantee the accuracy or completeness of this report and assumes no responsibility for any losses resulting from the use of this report. Do not rely on this report to replace your independent judgment. The market is risky, and investments should be made with caution.


