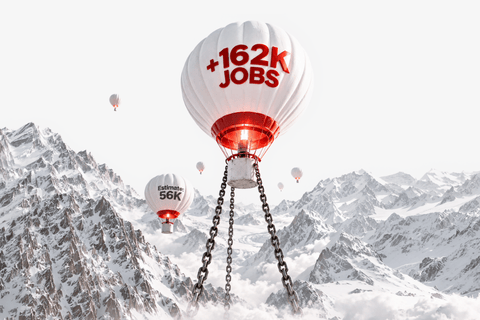


July nonfarm payrolls fell by 23,000, weakening Q3 rate-hike bets as labor demand cooled and USDJPY faced intervention-driven pressure.
Recent economic data continues to support D Prime’s earlier view that Fed rate-hike expectations may be too aggressive.
In previous articles, including “May 2026 Non-Farm Payrolls: Why the Jobs Beat May Not Trigger a Fed Hike” and “US June CPI Cools: Why Rate-Hike Fears May Still Be Overpriced,” D Prime argued that the market was moving too fast in pricing another Fed rate hike.
That view has played out.
Even after May nonfarm payrolls beat expectations and inflation stayed elevated in previous months, the Fed still held rates steady and skipped a July rate hike. D Prime continues to believe the probability of a Q3 rate hike remains low, with the Fed most likely staying on hold.
The upcoming CPI reading remains the biggest variable.
July Nonfarm Payrolls Review: A Major Downside Surprise
Before the July nonfarm payrolls report was released, D Prime stated on social media that the data had a high chance of missing expectations by a wide margin.
The reason was clear.
Earlier that week, the US released July ADP employment data, often called the “mini nonfarm report.” Private-sector employment increased by only 44,000, far below the market consensus of 70,000.
However, the market still expected official nonfarm payrolls to rise by 80,000, well above the previous reading of 57,000.
That gap suggested a large downside surprise was possible.
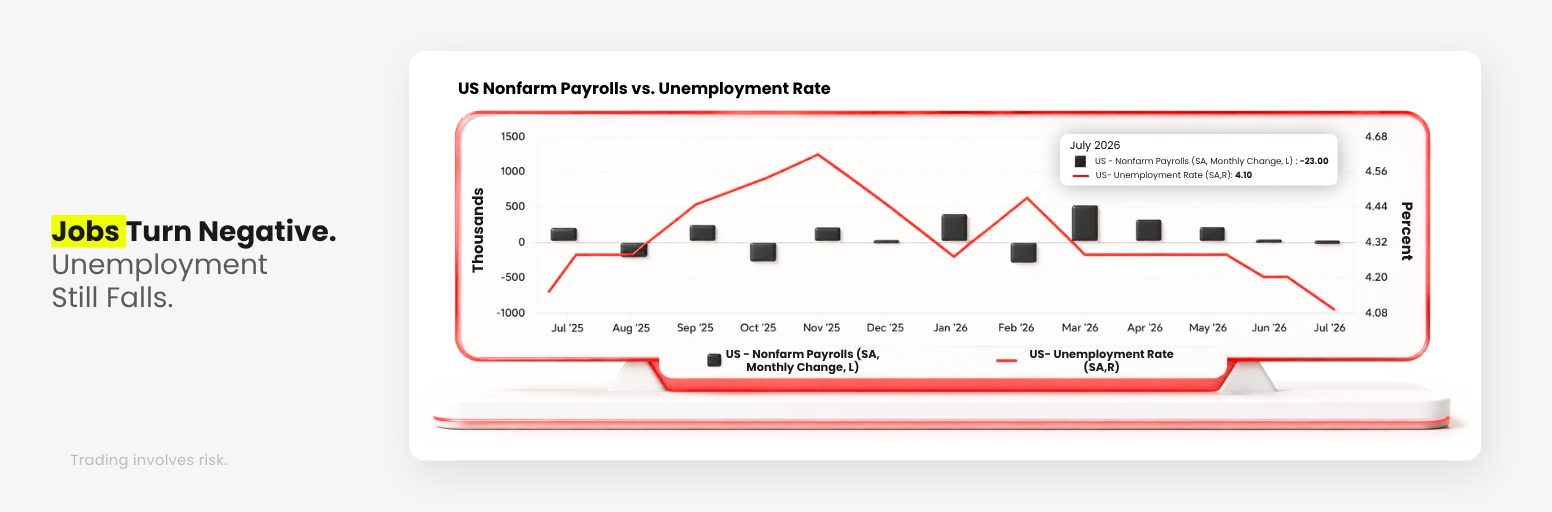
The official data confirmed it. July US nonfarm payrolls turned negative, falling by 23,000, compared with market expectations for an 80,000 gain.
This was not only caused by seasonal disruption or the fading employment boost from the World Cup. The data also pointed to a broader weakening of employment demand across industries. Recent US enforcement actions against illegal immigration may have added further pressure to labor supply and hiring conditions.
For traders, the message was clear: the US labor market is cooling faster than the headline unemployment rate suggests.
Sector Breakdown: World Cup Hiring Momentum Has Faded
By sector, goods-producing industries added 25,000 jobs in July. Of that increase, 22,000 came from construction, mainly due to seasonal summer-break effects.
Service industries added 50,000 jobs, but the details were less encouraging.
Employment in trade, transportation and utilities, financial activities, leisure and hospitality, and several other sectors declined month over month. Local government education employment fell by 50,000, also affected by seasonal summer-break patterns.
More importantly, the temporary employment boost linked to the World Cup appears to be fading.
Hotel and catering jobs, along with local government administrative positions that had benefited from World Cup-related activity, turned negative in July. Leisure and hospitality employment dropped by 40,000, following a 43,000 decline in the previous month.
This suggests the World Cup hiring boost is no longer supporting the labor market as strongly as before.
Looking at the longer-term trend, the overall direction of the US labor market has not changed. It is weakening and gradually moving toward relative balance.
D Prime describes the current labor market as showing signs of “falling volume, stable prices.”
In other words, nonfarm payroll readings are falling, while the unemployment rate and hourly wage growth remain relatively steady.
As short-term support from fiscal stimulus and World Cup hiring fades, and as tighter financial conditions continue to work through the economy, US growth may cool further in Q3.
Why the Lower Unemployment Rate Is Not a Strong Signal
Some investors may look at the unemployment rate and see a more positive picture.
In July, the US unemployment rate fell to 4.1%, below both market expectations and the previous reading of 4.2%.
At first glance, that looks like strength.
But the decline was mainly driven by a contraction in labor supply, not stronger labor demand.
Household survey data showed that household employment fell by 87,000 in July. The number of unemployed people fell by 178,000, while the total labor force shrank by 264,000.
That means the unemployment rate fell because fewer people were counted in the labor force, not because hiring improved.
This matters for Fed policy.
Although markets have recently focused heavily on CPI, employment remains one of the Fed’s key variables when assessing rate-hike decisions. If employment stays weak, Fed hawks will likely struggle to build support for another hike.
D Prime therefore maintains its earlier forecast: the chance of a Q3 rate hike is low.
Whether the Fed hikes in Q4 will depend on incoming economic data, especially CPI, oil prices, and labor-market conditions.
Does Weak Payroll Data Signal a Recession?
Weak payrolls naturally raise another question:
Is the economy heading into recession?
D Prime does not think so.
The Fed mainly watches three variables when deciding whether to raise rates: economic growth, employment, and inflation.
For economic growth, D Prime already shared its view in “US Q2 GDP Growth Slows, But Recession Fears Look Overdone.” While Q2 GDP growth cooled significantly, consumption and private investment improved, meaning the US economy was not as weak as the headline number suggested.
That said, the sustainability of growth remains a valid concern.
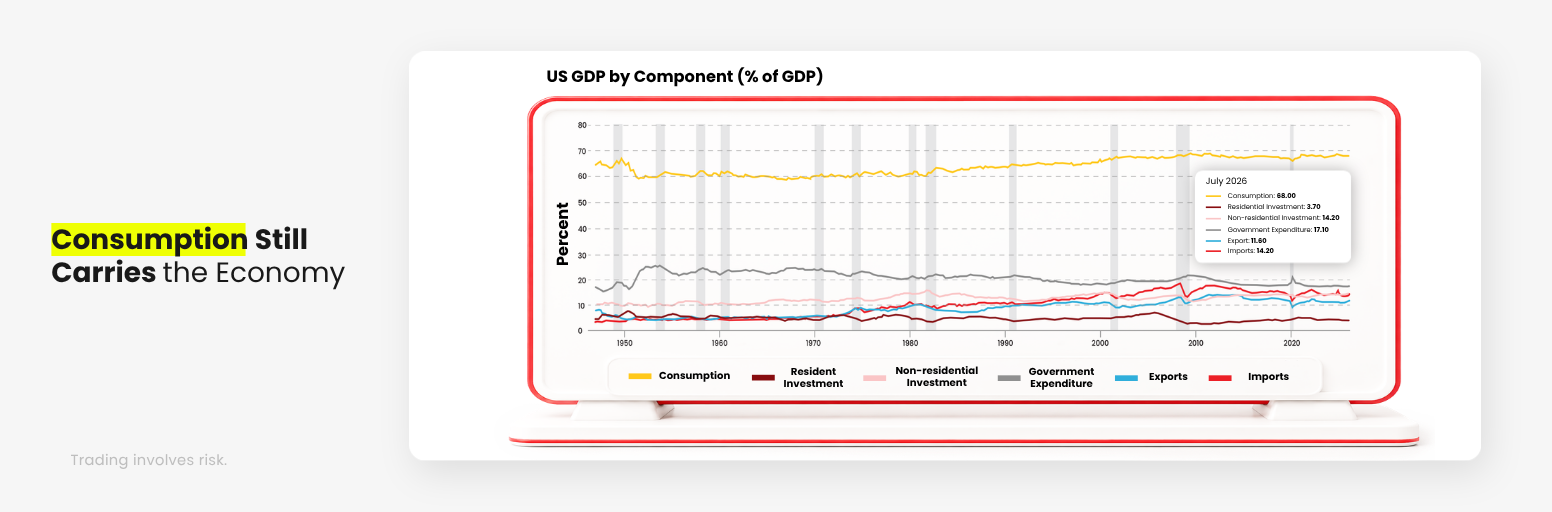
US personal consumption expenditures rose from 0.54% to 3.16% month over month. However, this rebound was partly supported by tax rebate benefits, meaning it may not fully reflect organic consumption strength.
By category, goods consumption growth rose from 0.5% to 5.3% month over month. Durable goods posted 6.8% growth, led by automobiles and furniture, which rose 10.5% and 12.0%, respectively.
Non-durable goods rose 4.4%, with apparel up 4.3% and food and beverages up 2.3%.
But energy consumption fell 4.9%, showing that high international oil prices are already suppressing demand.
Services consumption also improved. Q2 services growth rose from 0.5% to 2.2% month over month, with leisure services, food and accommodation, financial and insurance services, and transportation services outperforming the overall services average.
However, part of this strength was also linked to the World Cup.
So while consumption is still supporting the economy, not all of the rebound looks sustainable.
Why Recession Fears Still Look Overdone
The economy is slowing, but it is not collapsing.
Trade remains one of the drags on growth, but high oil prices have also created one offsetting effect for the US. As Middle East oil supply was disrupted, US shale oil exports surged due to substitution demand, rising 67.5% month over month.
Government spending is another drag. Since Trump took office, the US federal government has been cutting spending. Apart from volatility caused by the federal government shutdown in Q4 last year, overall government spending has stayed relatively stable, while its boost to the economy has continued to shrink.
Even so, D Prime does not believe the global economy is heading into recession or stagflation.
Consumption still has internal momentum. AI investment growth has slowed, but it remains higher than overall economic growth. The bigger issue is that market confidence in AI investment has weakened, especially in the stock market.
Overall growth may remain soft, but the economy still has enough support to avoid a deeper downturn for now.
Combined with weaker employment data, this further reduces the probability of a near-term Fed rate hike.
USD/JPY Outlook: Is the Yen Rebound a Trend Reversal?
The weaker labor-market data also matters for the US dollar.
For months, USD/JPY had continued hitting new highs as markets priced in stronger US rate-hike expectations. But after recent joint US-Japan intervention, USD/JPY dropped sharply and has now fallen below 160. The US Dollar Index has also started to trend lower.
This raises an important trading question:
If rate-hike expectations fade and the “strong dollar” trade is already fully priced in, could USD/JPY pull back further?
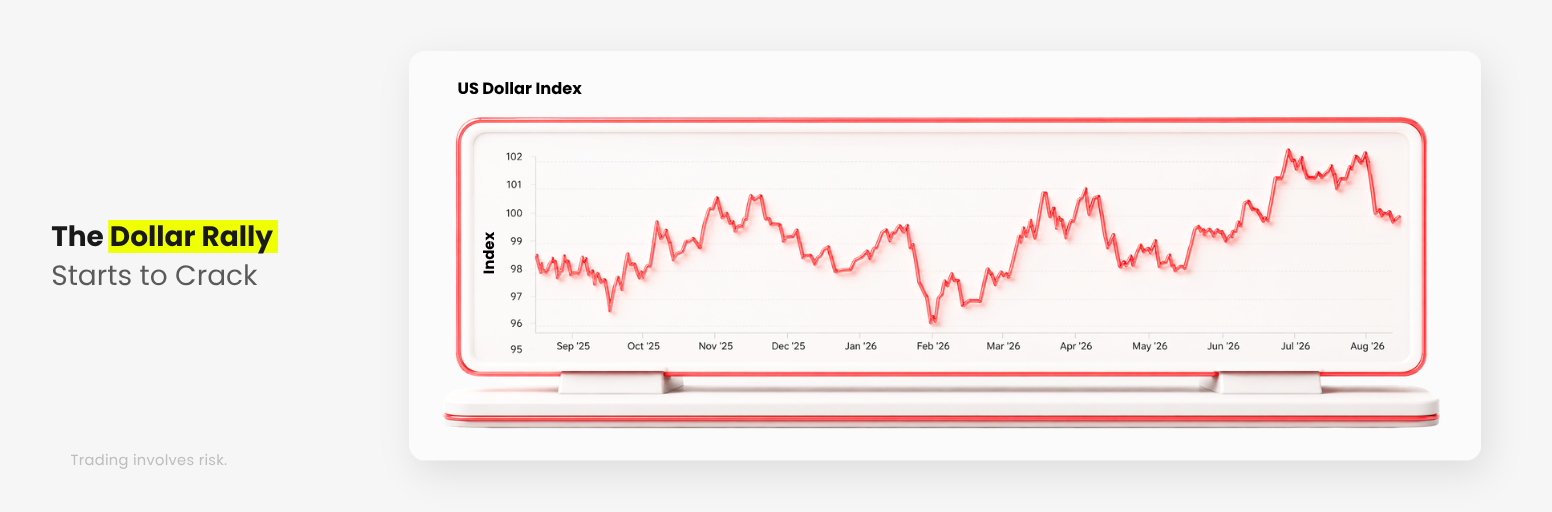
In the short term, yes.
But D Prime does not believe the recent yen rebound should automatically be treated as a long-term trend reversal.
The first reason is that forex intervention tends to have a short-term effect.
Japan has carried out several large interventions in recent years. From late April to early May 2024, Japan’s Ministry of Finance spent nearly JPY 10 trillion buying yen and selling dollars. In mid-July 2024, it added more than JPY 5 trillion in further intervention.
Together, those two rounds used around JPY 15.3 trillion, setting a new record for Japan’s forex intervention.
In 2026, Japan used around JPY 11.73 trillion to buy yen, making it one of the largest single-month intervention operations in official records.
But the pattern has been consistent: the yen rises briefly after intervention, then eventually returns to its broader depreciation path.
Why USD/JPY May Still Have Long-Term Support
Forex intervention can affect short-term exchange-rate moves, but long-term currency trends still depend on fundamentals.
The yen still has structural reasons to remain weak against the US dollar.
After Japan’s asset bubble burst in 1990, Japan’s real per-capita productivity continued to decline relative to the US. This is one of the long-term reasons behind yen depreciation.
The US-Japan interest-rate gap is even more important.
The core driver behind long USD/JPY positioning is the carry trade. Investors borrow low-yielding yen and use those funds to buy higher-yielding US assets, especially US Treasuries.
In recent years, US public debt has expanded significantly. Larger Treasury issuance has pushed up US Treasury yields, making the carry trade more attractive. This creates selling pressure on the yen and supports USD/JPY.
That means the recent USD/JPY correction likely reflects two factors: joint US-Japan intervention and the market pricing in weaker Fed rate-hike expectations.
But from a long-term perspective, this correction may create another long USD/JPY opportunity rather than signal a structural yen reversal.
Fed Patience Still Looks More Likely
D Prime maintains its previous view on rate hikes.
Conditions for another Fed hike are not mature right now. Employment is weakening, growth is cooling, and the Fed has reason to avoid tightening too aggressively in Q3.
At the same time, it is too early to call for a sustained weaker dollar. Inflation has not been fully resolved, and oil prices remain an important risk.
For USD/JPY, the recent yen rebound looks more like an intervention-driven correction than a lasting trend reversal.
In the long run, the yen still has fundamental reasons to weaken against the dollar.
For traders, the key variables remain clear: CPI, oil prices, Fed signals, labor-market data, and USD/JPY intervention risk.
By D Prime Analysis Team
Macro and market strategy research by D Prime’s in-house analysis team.
Disclaimer
The information contained herein is provided for general informational and educational purposes only and does not constitute investment advice, financial advice, trading advice or any other form of professional advice, a recommendation, or an offer or solicitation to buy or sell any financial instruments or engage in any trading strategy.
Trading in leveraged products such as contracts for difference (CFDs) involves a significant risk of loss and may not be suitable for all investors. Past performance is not indicative of future results. Any references to market trends, asset performance, price levels, or forward-looking statements reflect opinions or general market commentary as at the date of publication and are subject to change without notice.
This article does not take into account any individual investor’s objectives, financial situation, or risk tolerance. Readers should conduct their own independent research and seek professional advice before making any investment or trading decisions. D Prime and its affiliates make no representations or warranties about the accuracy or completeness or reliability of this information and disclaim any and all liability for any direct, indirect, incidental, consequential, or other losses or damages arising out of or in connection with the use of or reliance on any information contained herein. The above information should not be used or considered as the basis for any trading decisions or as an invitation to engage in any transaction. Do not rely on this article to replace your independent judgment.
“D Prime” is a brand name of D Prime Vanuatu Limited, a company incorporated and regulated by the Vanuatu Financial Services Commission (Company Number: 700238). The availability of products and services may vary depending on jurisdiction and applicable regulatory requirements.